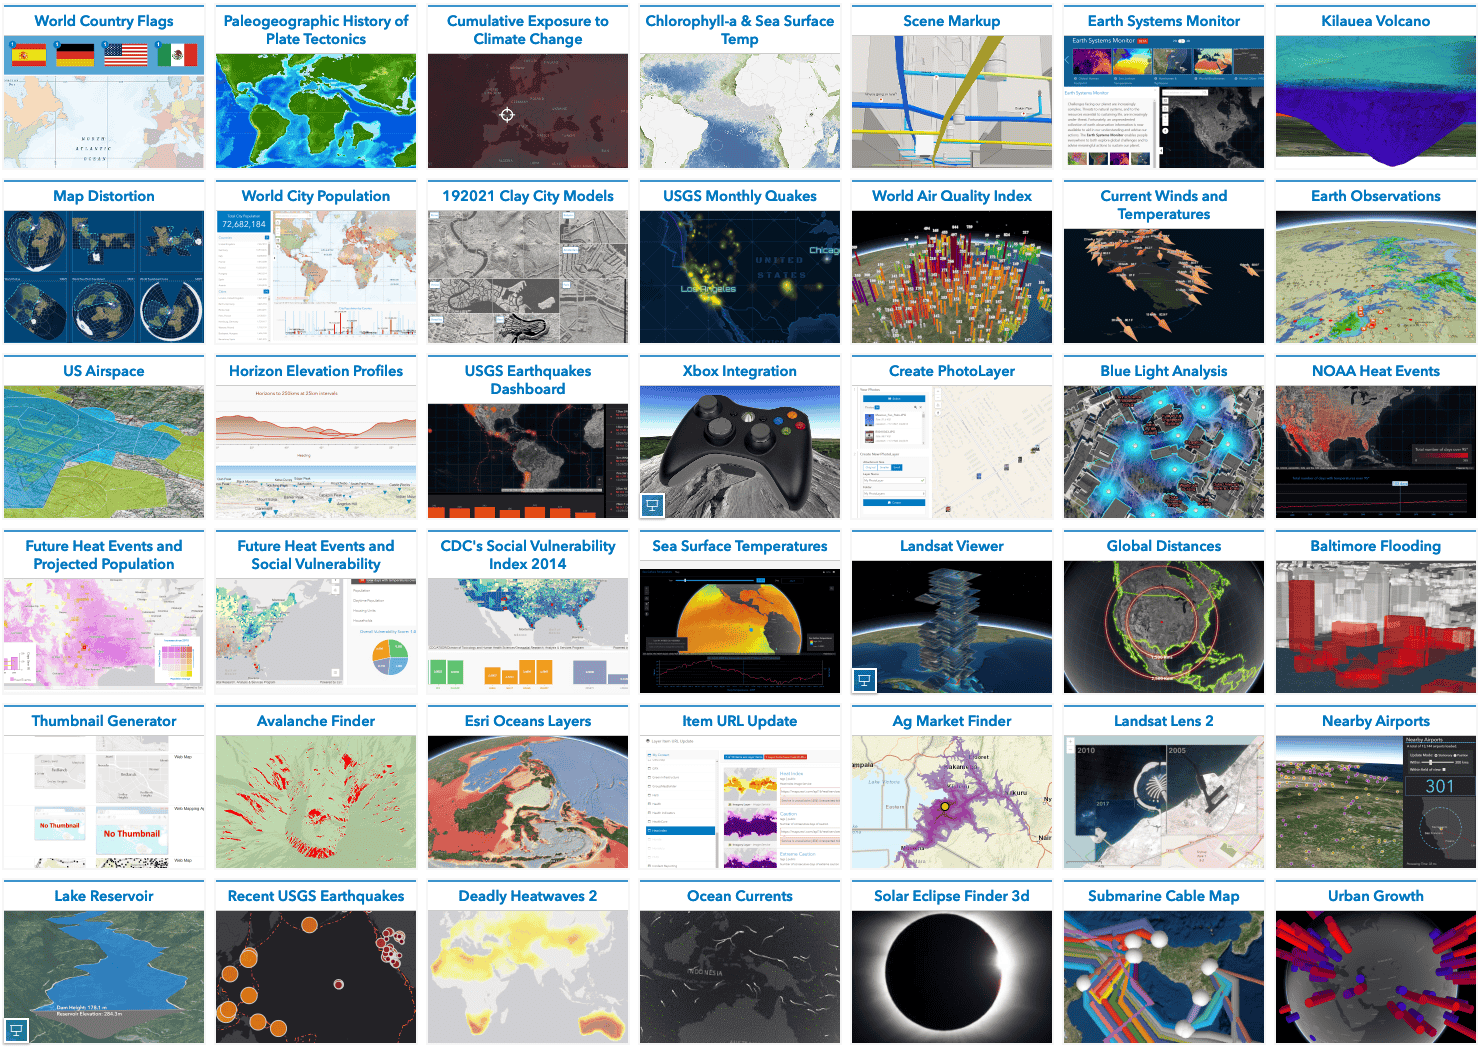
Explore various demonstrations showcasing how to use the ArcGIS Maps SDK for JavaScript to build compelling web apps that unlock your data’s potential with interactive user experiences and stunning 2D and 3D visualizations.
3D
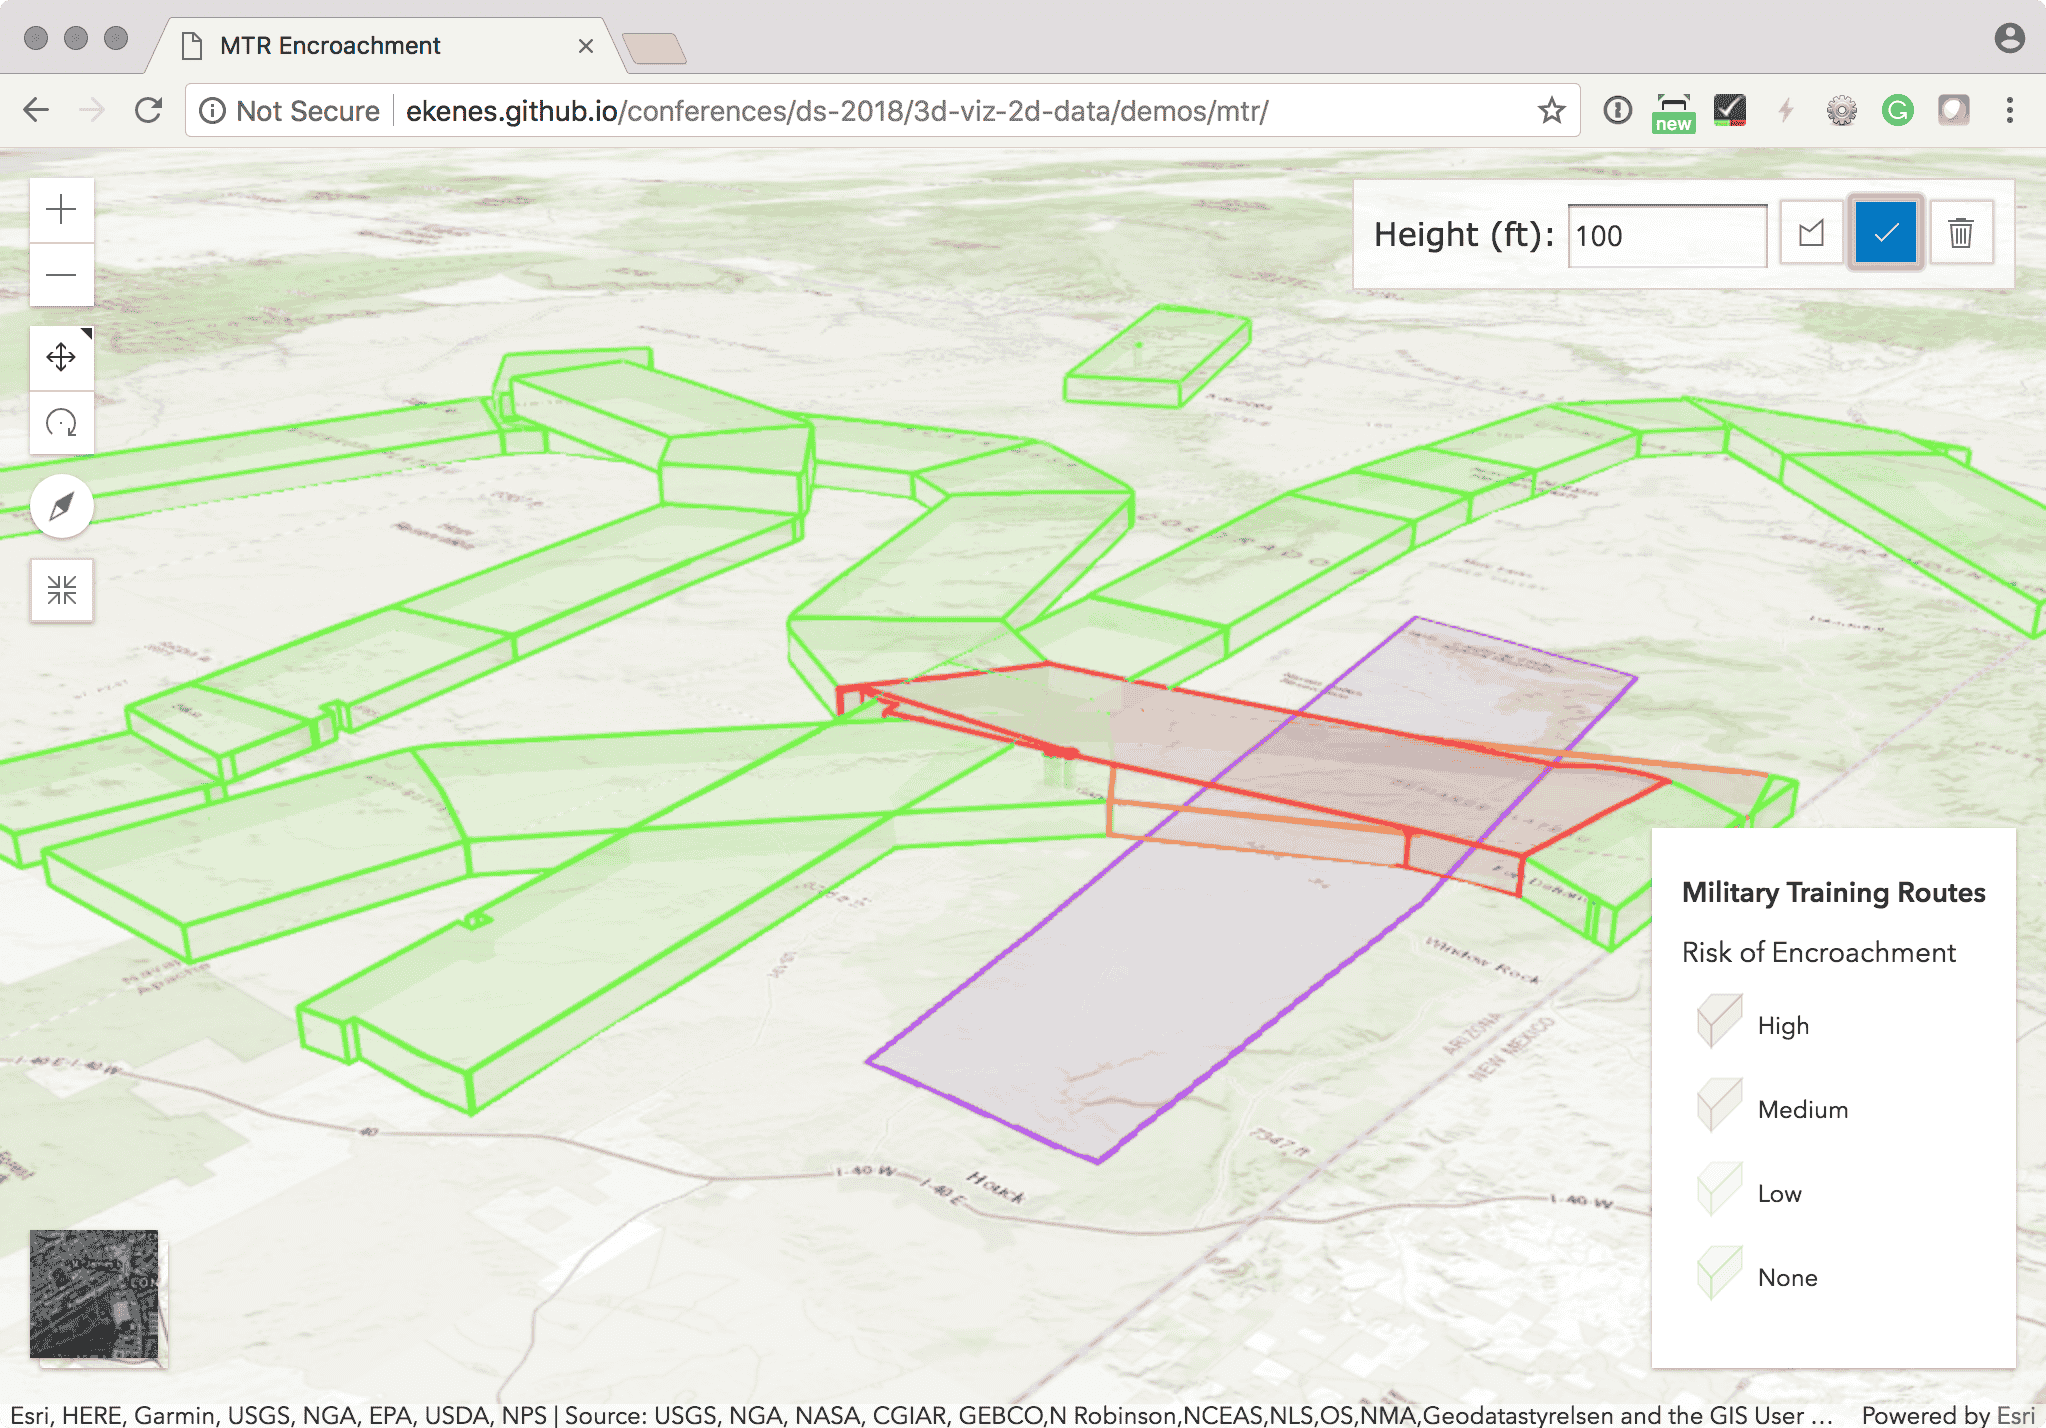
3D Airspace Encroachment Analysis
Visualize military training routes (MTR) based on whether a proposed project area (including its height) encroaches the reserved airspace.
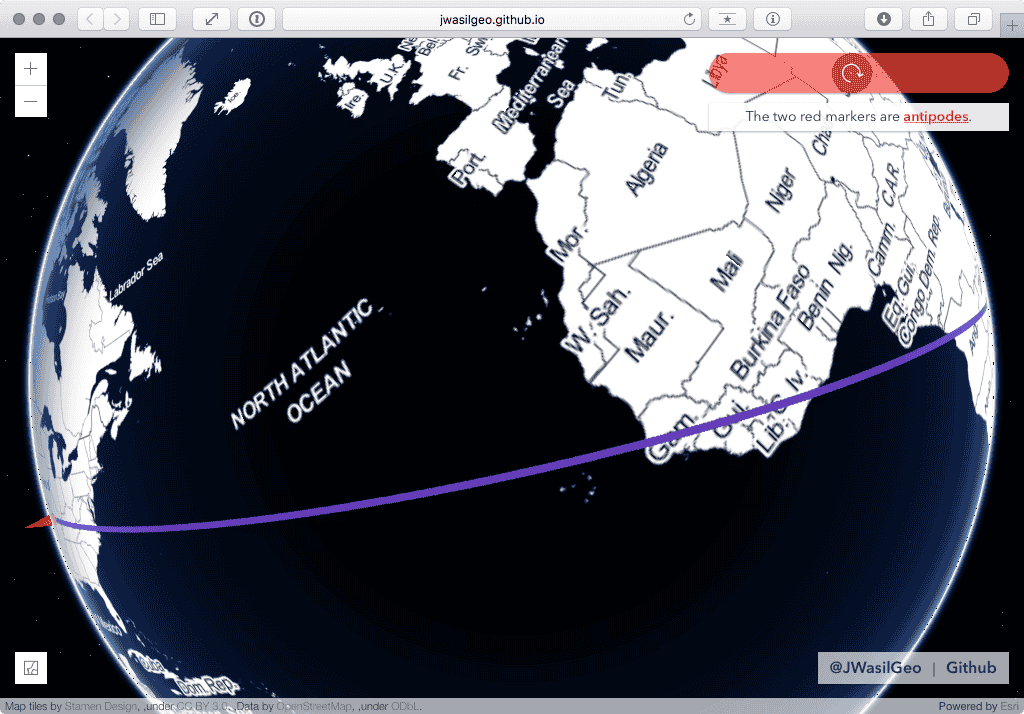
Around the world
Find out what lies across the ocean and beyond by traveling around the Earth (3D in a desktop browser, 2D on a mobile device).
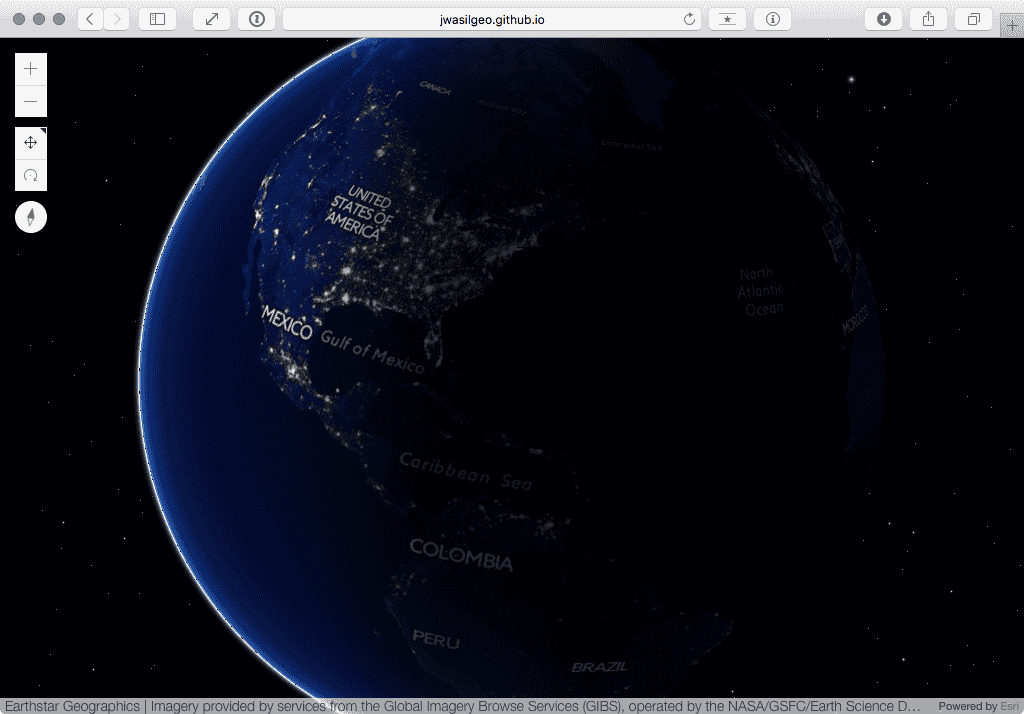
Earth at night
Explore the Earth at night as seen by Suomi NPP VIIRS.
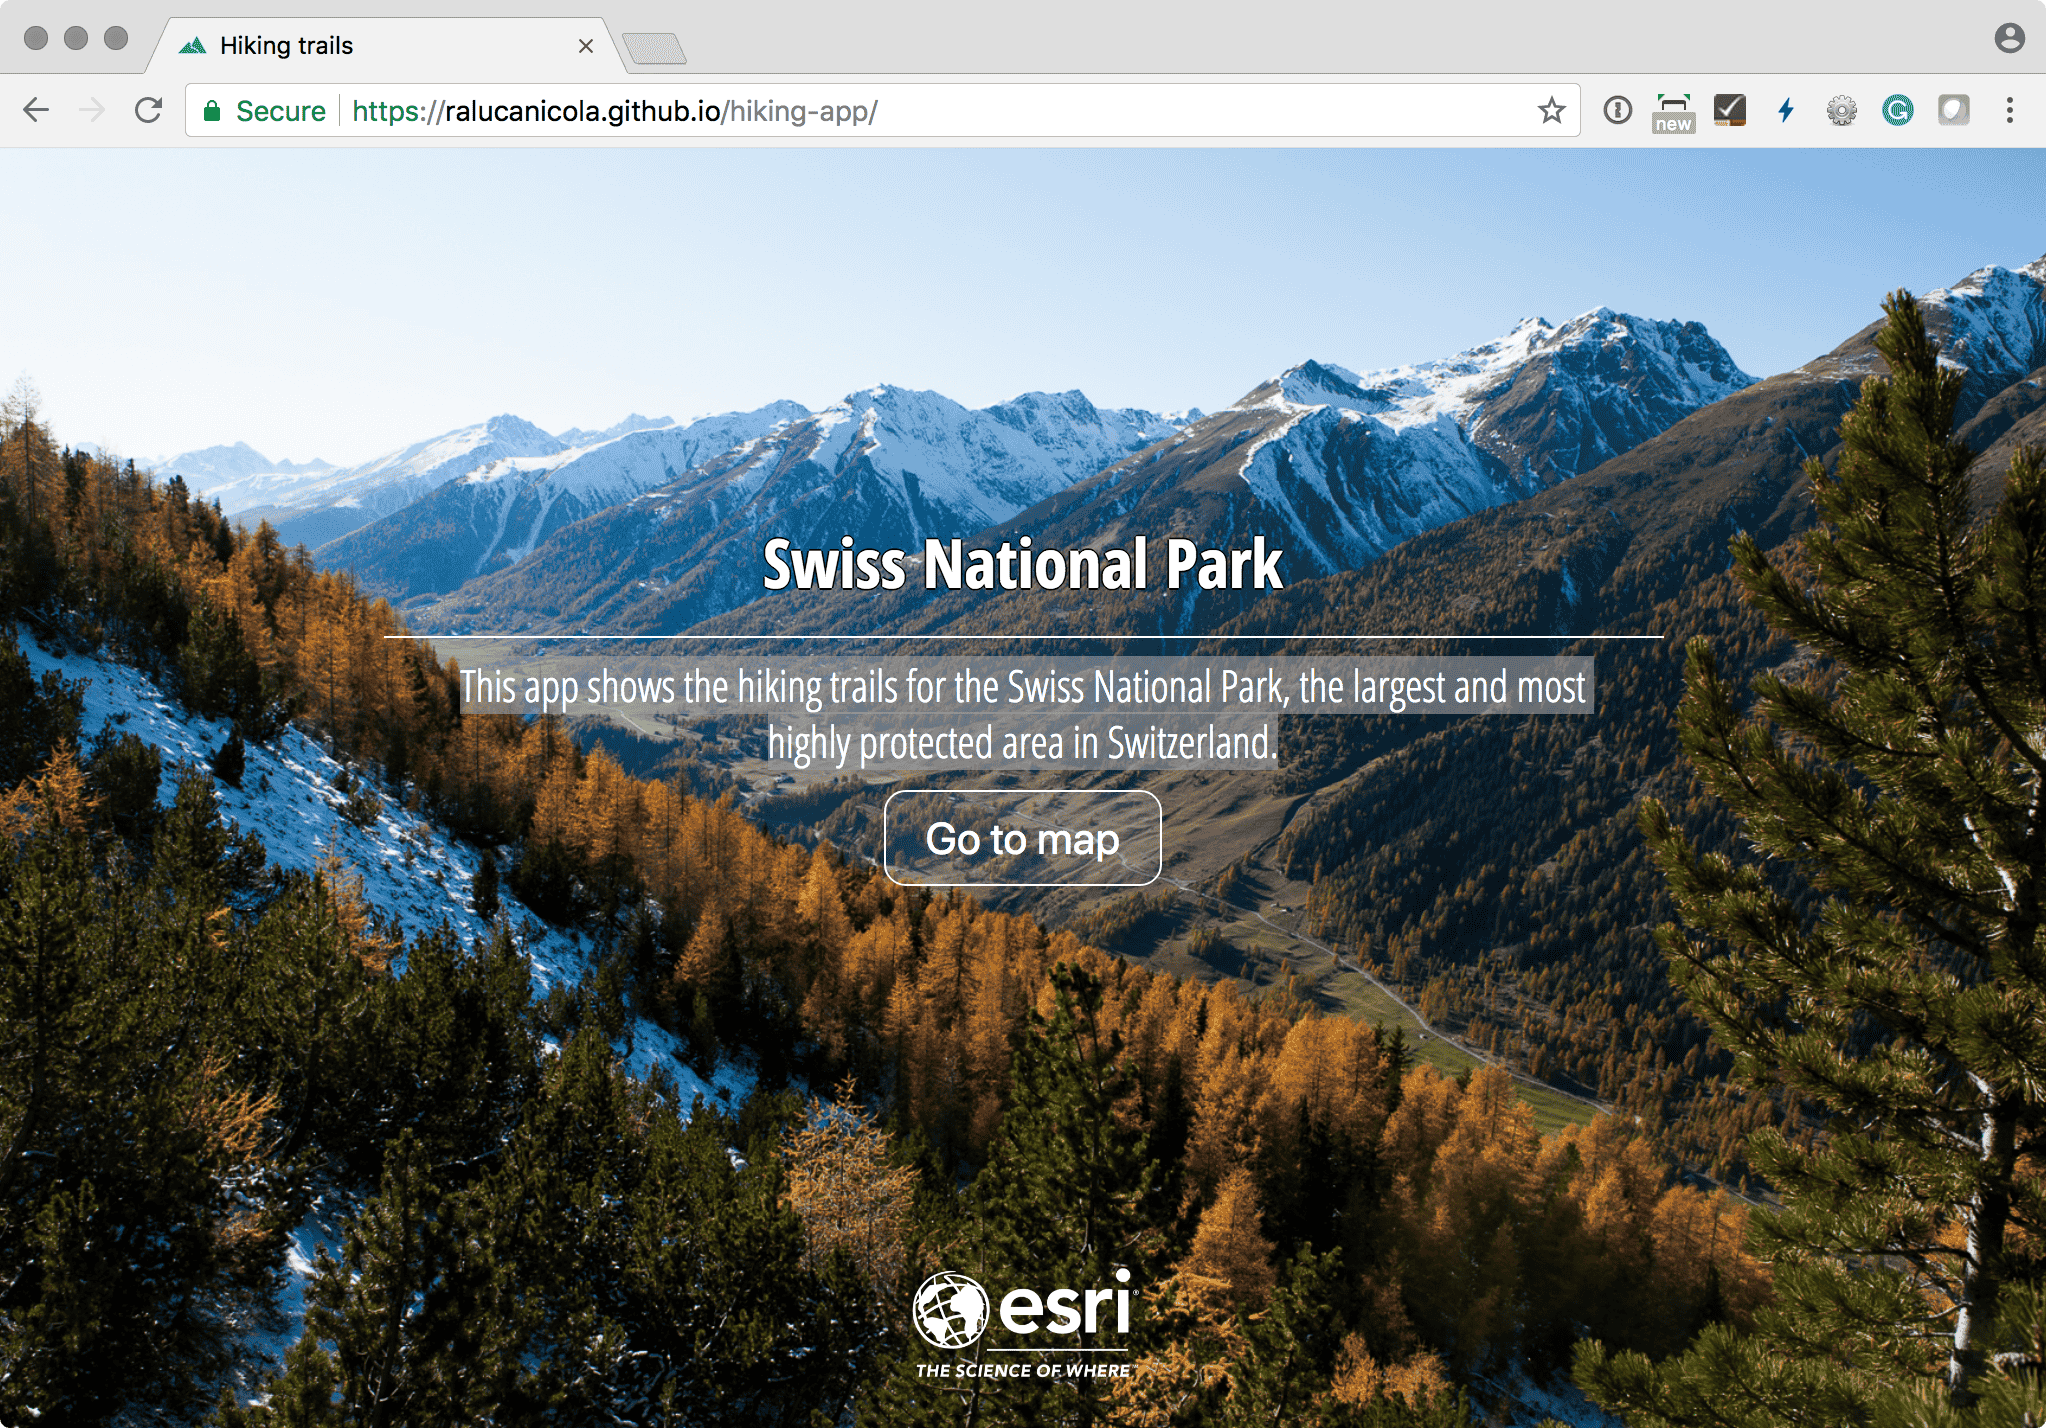
Hiking trails in Swiss National Park
This app shows the hiking trails for the Swiss National Park, the largest and most highly protected area in Switzerland.
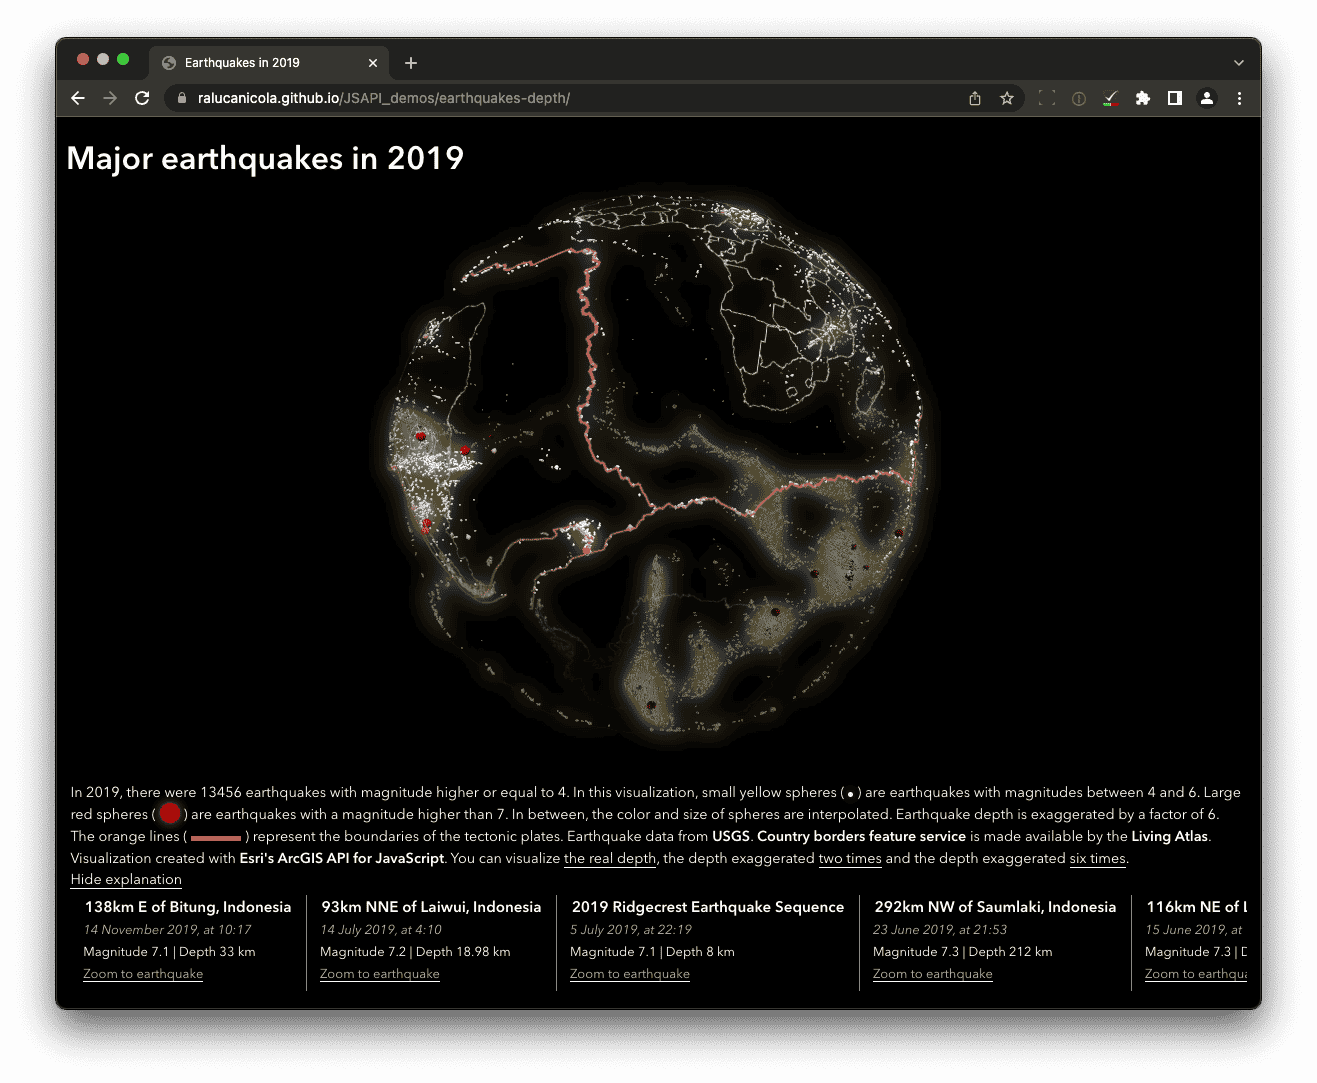
Major earthquakes in 2019
In 2019, there were 13456 earthquakes with magnitude higher or equal to 4. In this visualization, small yellow spheres are earthquakes with magnitudes between 4 and 6. Large red sphere are earthquakes with a magnitude higher than 7. In between, the color and size of spheres are interpolated. Earthquake depth is exaggerated by a factor of 6. The orange lines represent the boundaries of the tectonic plates.
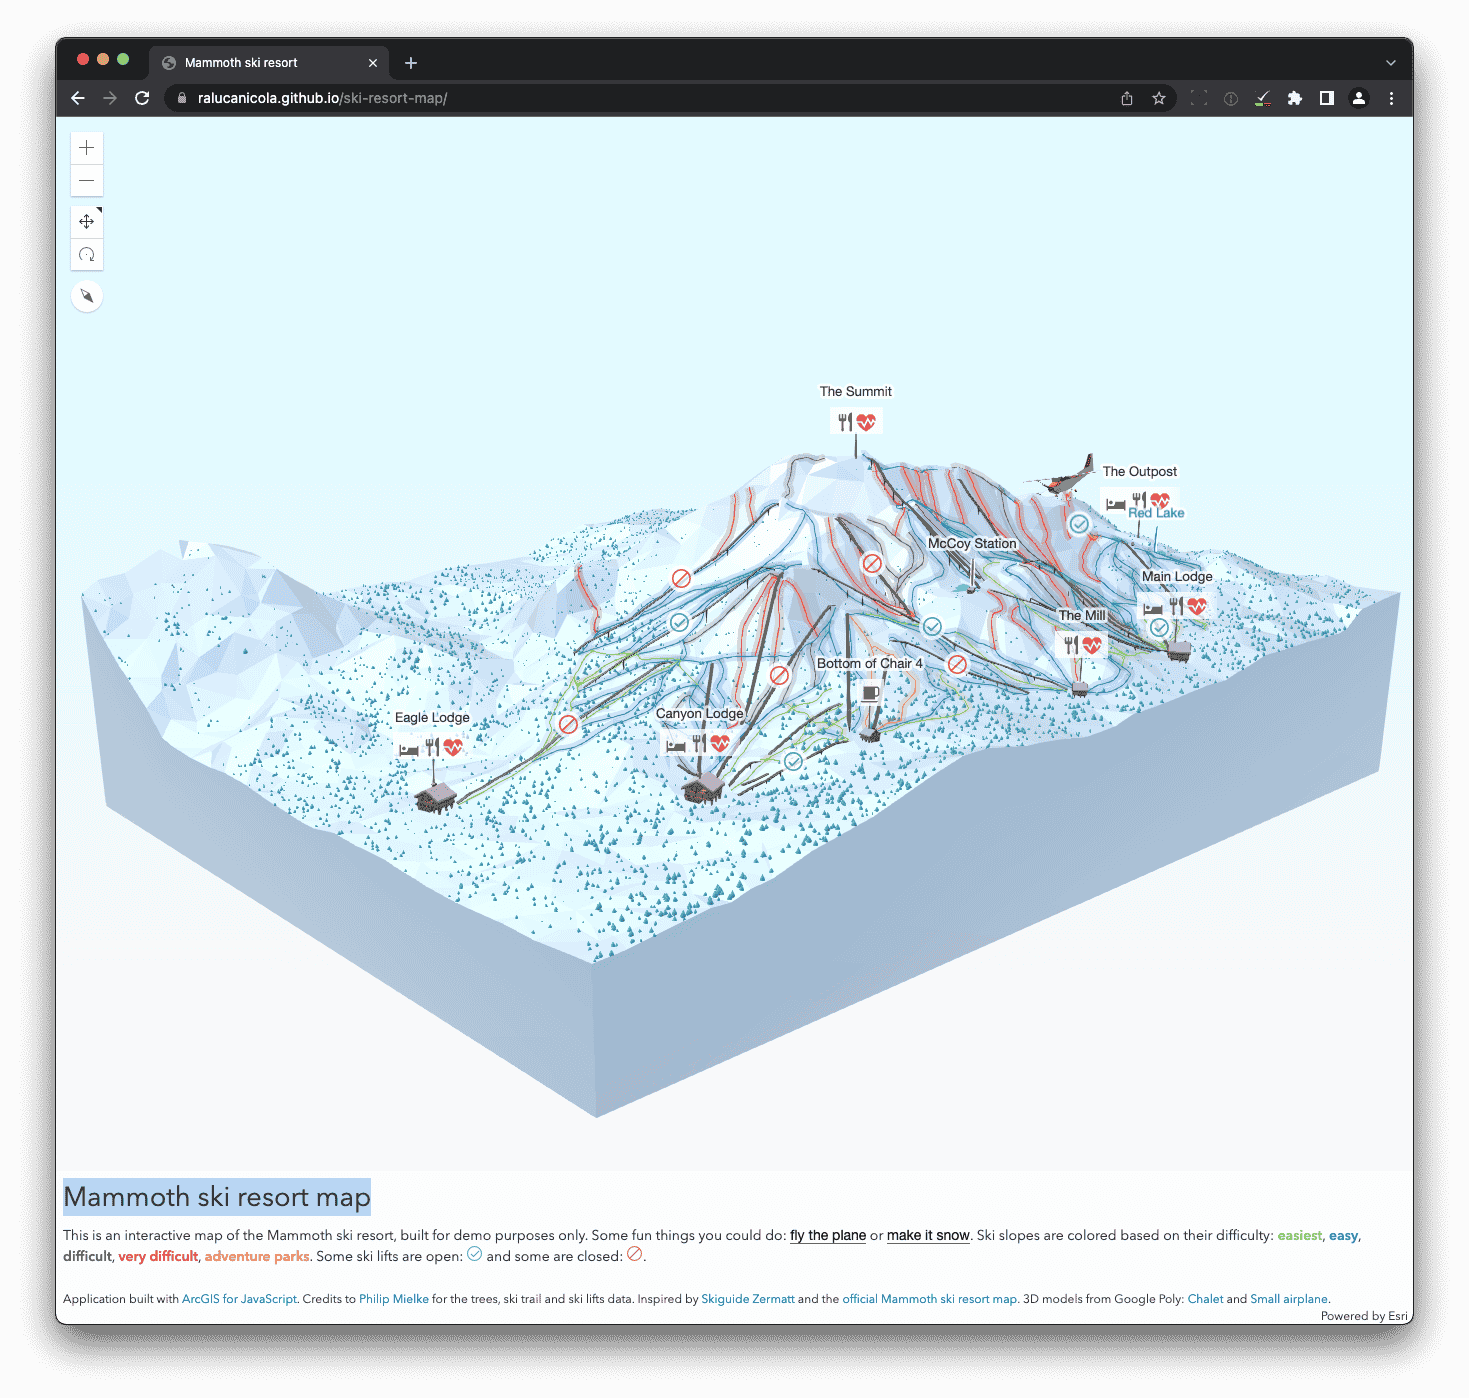
Mammoth ski resort map
This is an interactive map of the Mammoth ski resort, built for demo purposes only. Some fun things you could do: fly the plane or make it snow. Ski slopes are colored based on their difficulty: easiest, easy, difficult, very difficult, adventure parks. Some ski lifts are open and some are closed.
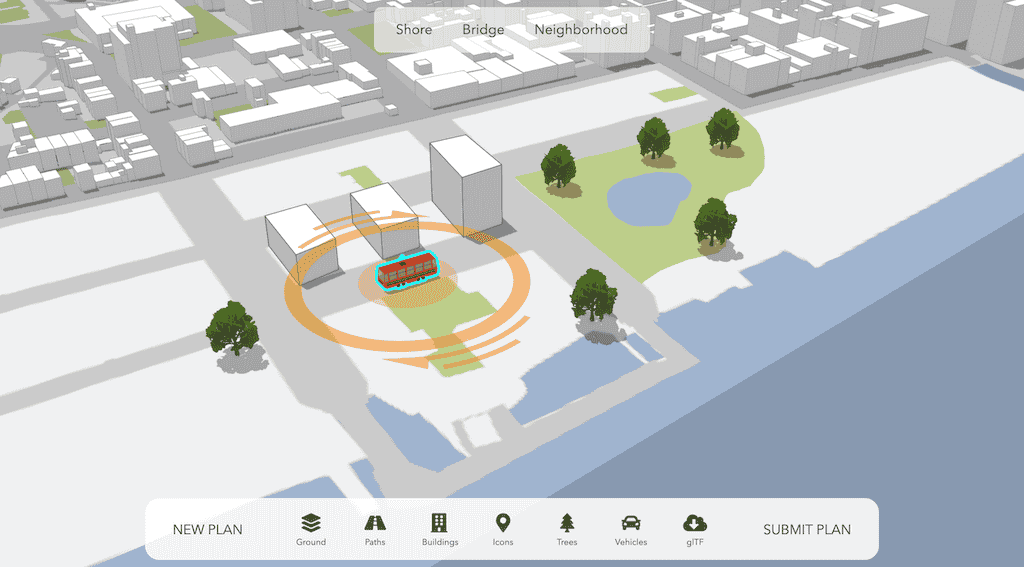
Participatory Planning
An interactive 3D web application enabling citizens to engage in urban planning, using the ArcGIS API for JavaScript.
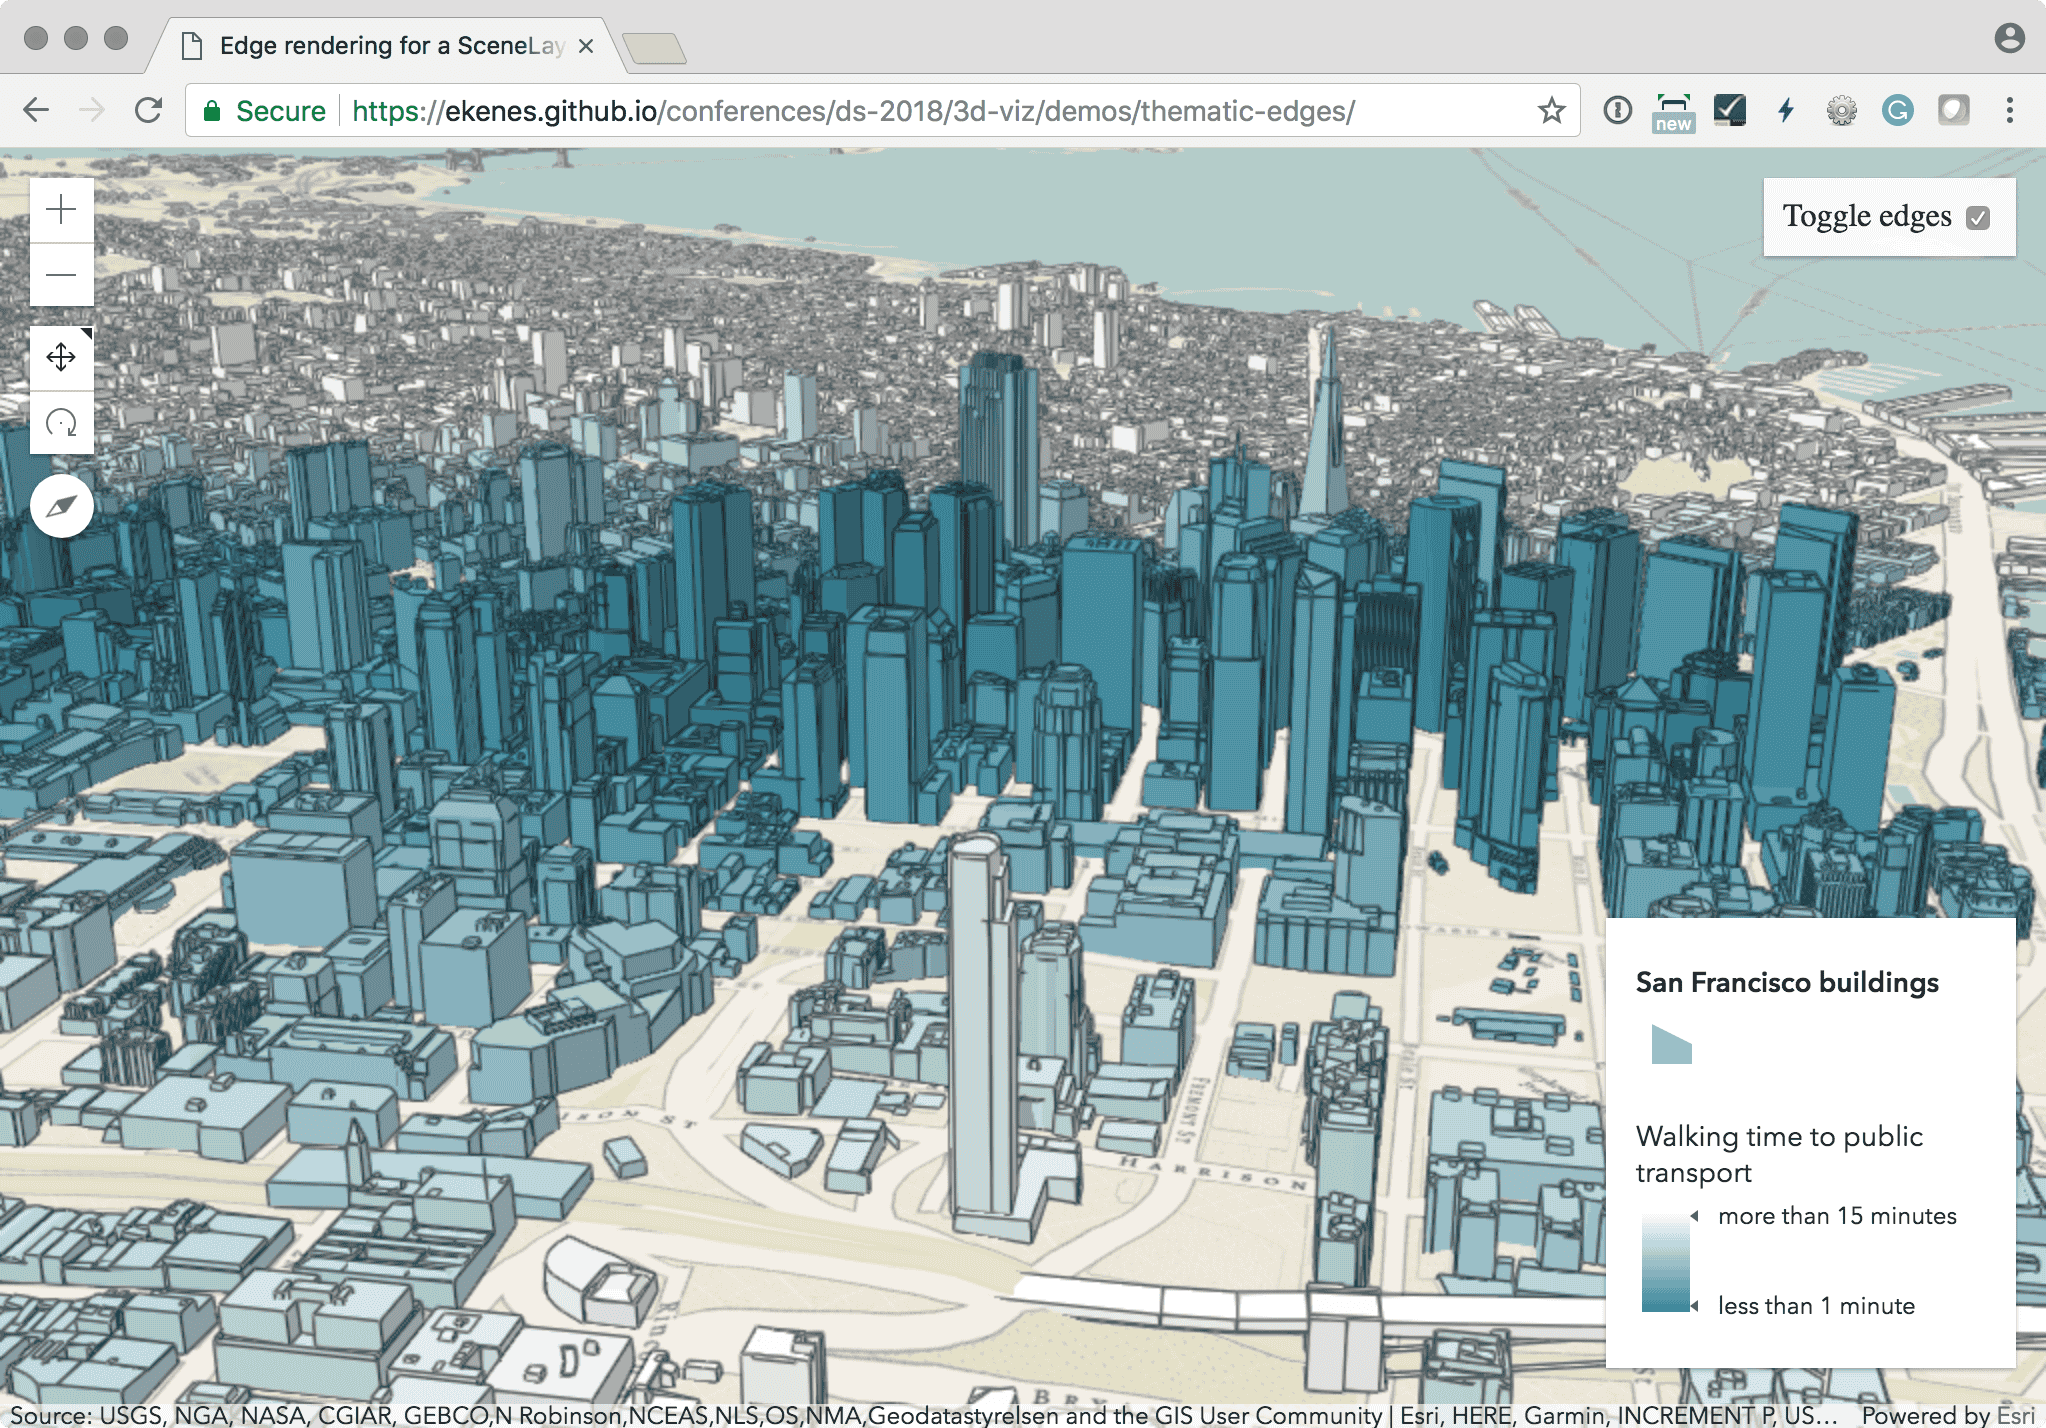
Render buildings with edges
Add edges to improve the thematic visualization of buildings in San Francisco.
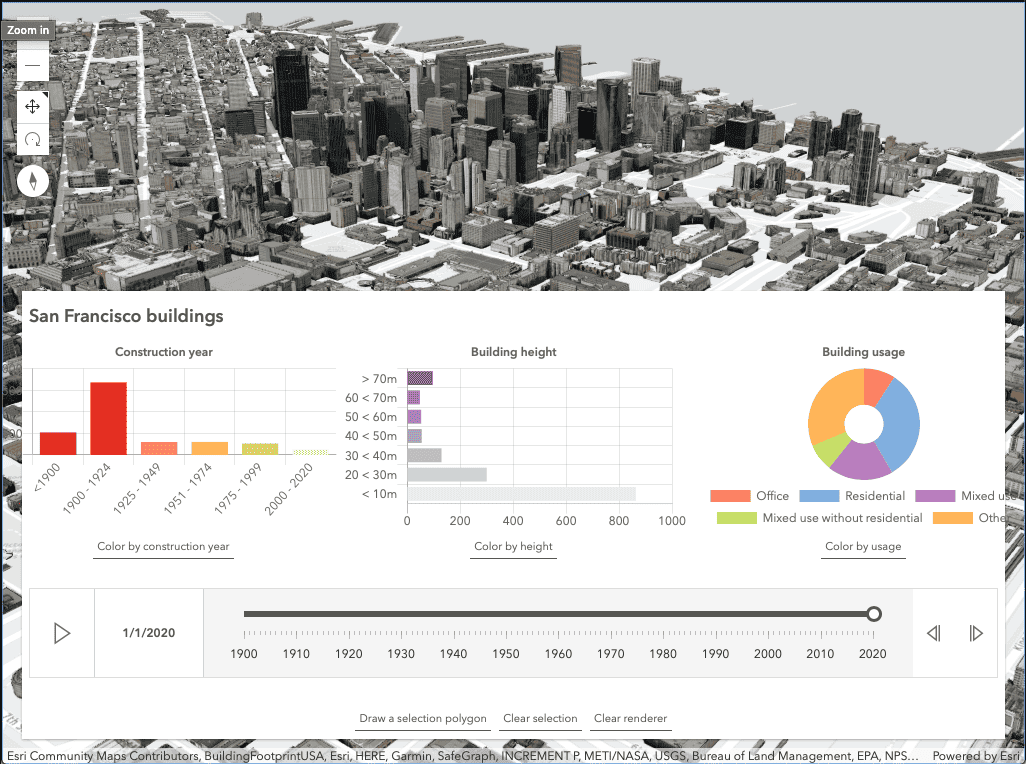
San Francisco buildings
Explore various building types by construction year, height, and usage in this 3D San Francisco landscape.
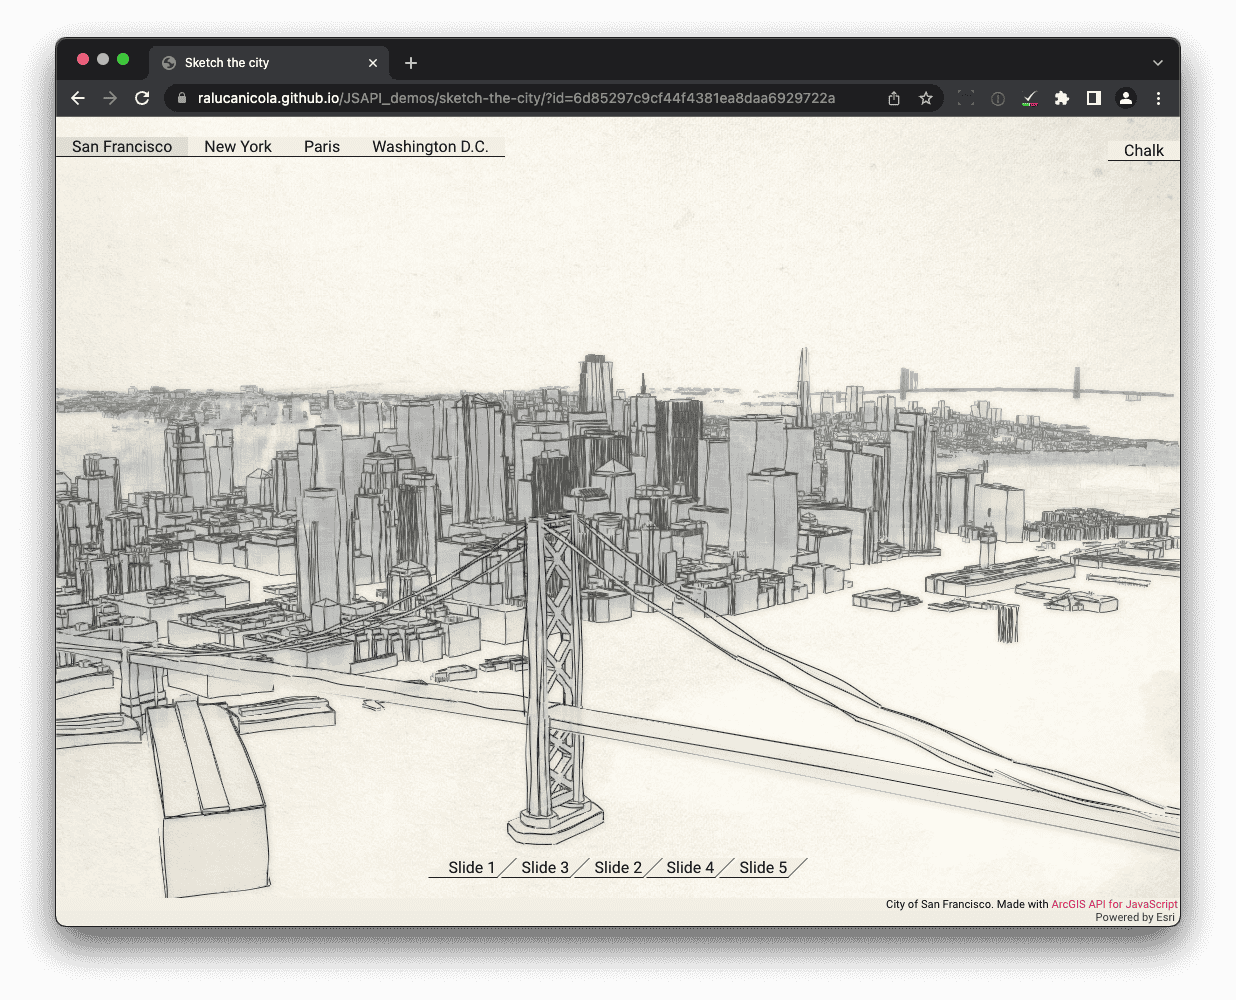
Sketch the city
Displays different cities as a hand drawn 3D sketch. There are 2 styles available: chalk on blackboard and pencil on canvas.
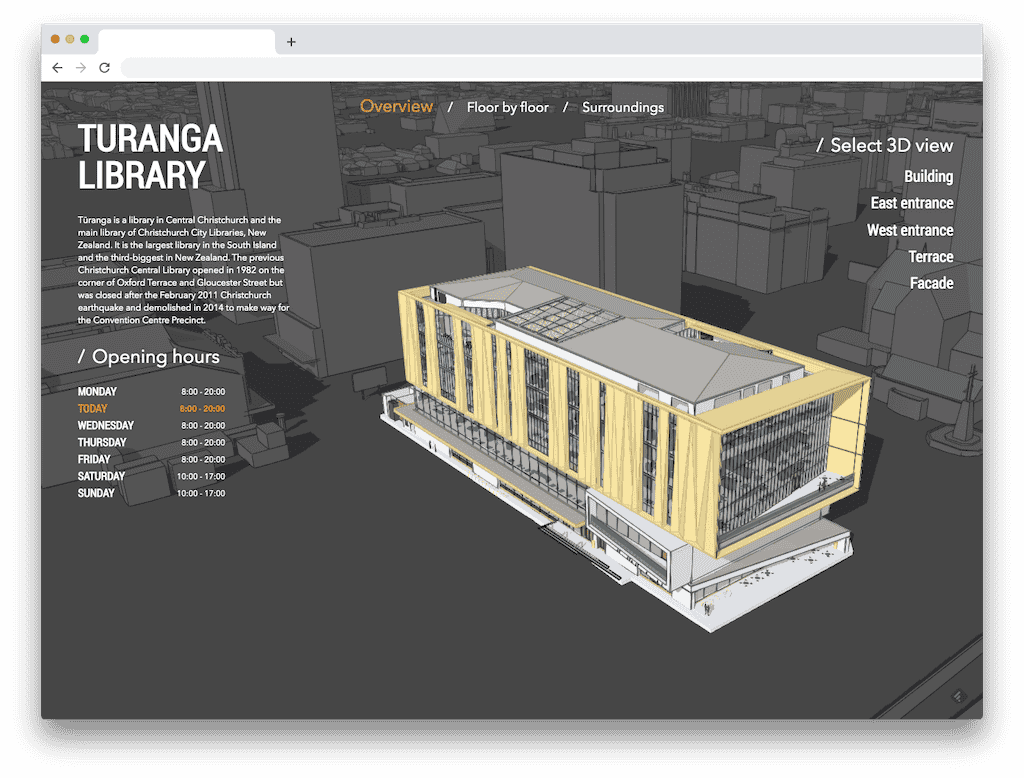
Turanga Library
The application presents the Turanga library in 3D. The visitor can explore the library by navigating around, and then inside, floor by floor, to discover this amazing building.
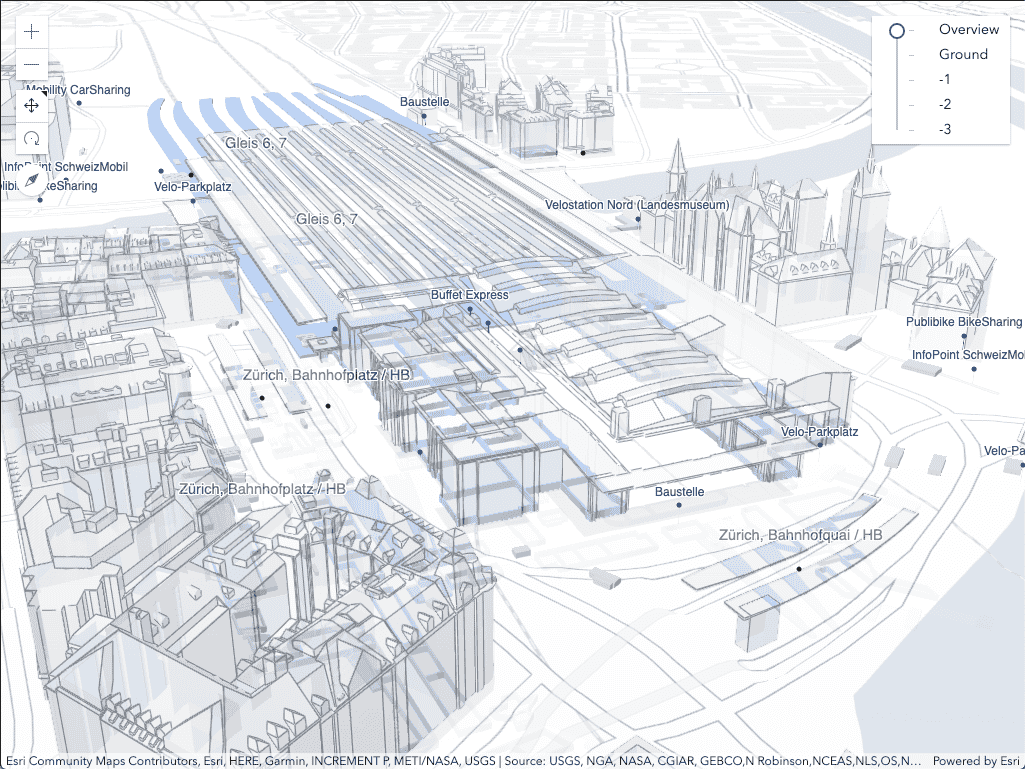
Zürich Hauptbahnhof
Explore the largest railway station in Switzerland with this 3D visualization. Serving up to 2,915 trains per day, Zürich HB is one of the busiest railway stations in the world.
coolmaps
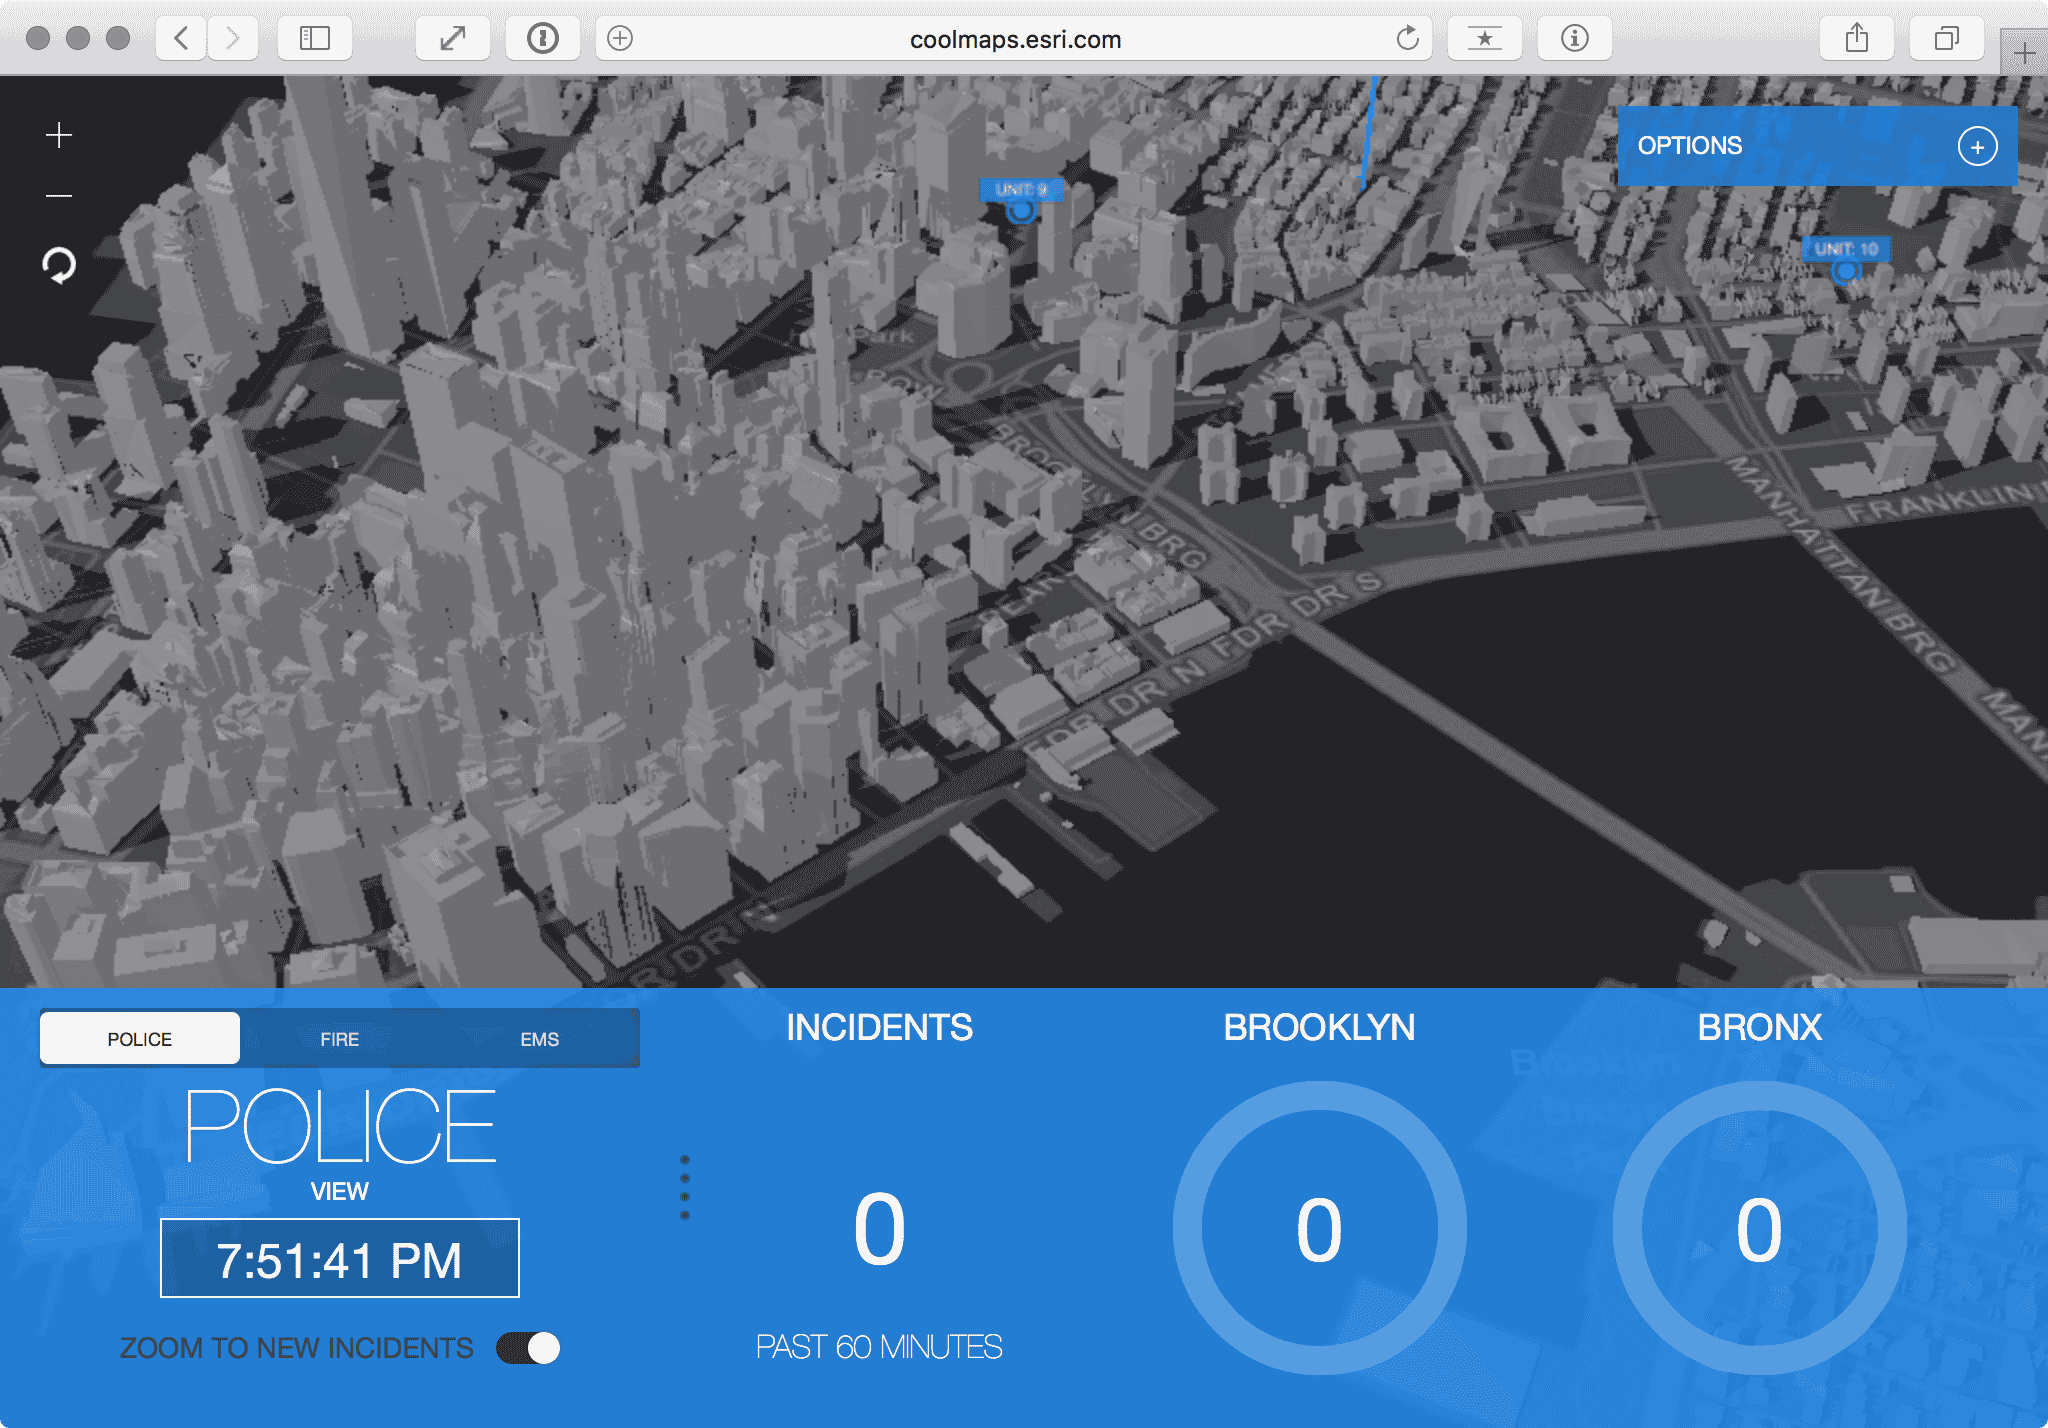
3D Common Operational Picture
Next-gen smart city COP prototype. Monitoring public safety incidents & assets in real-time.
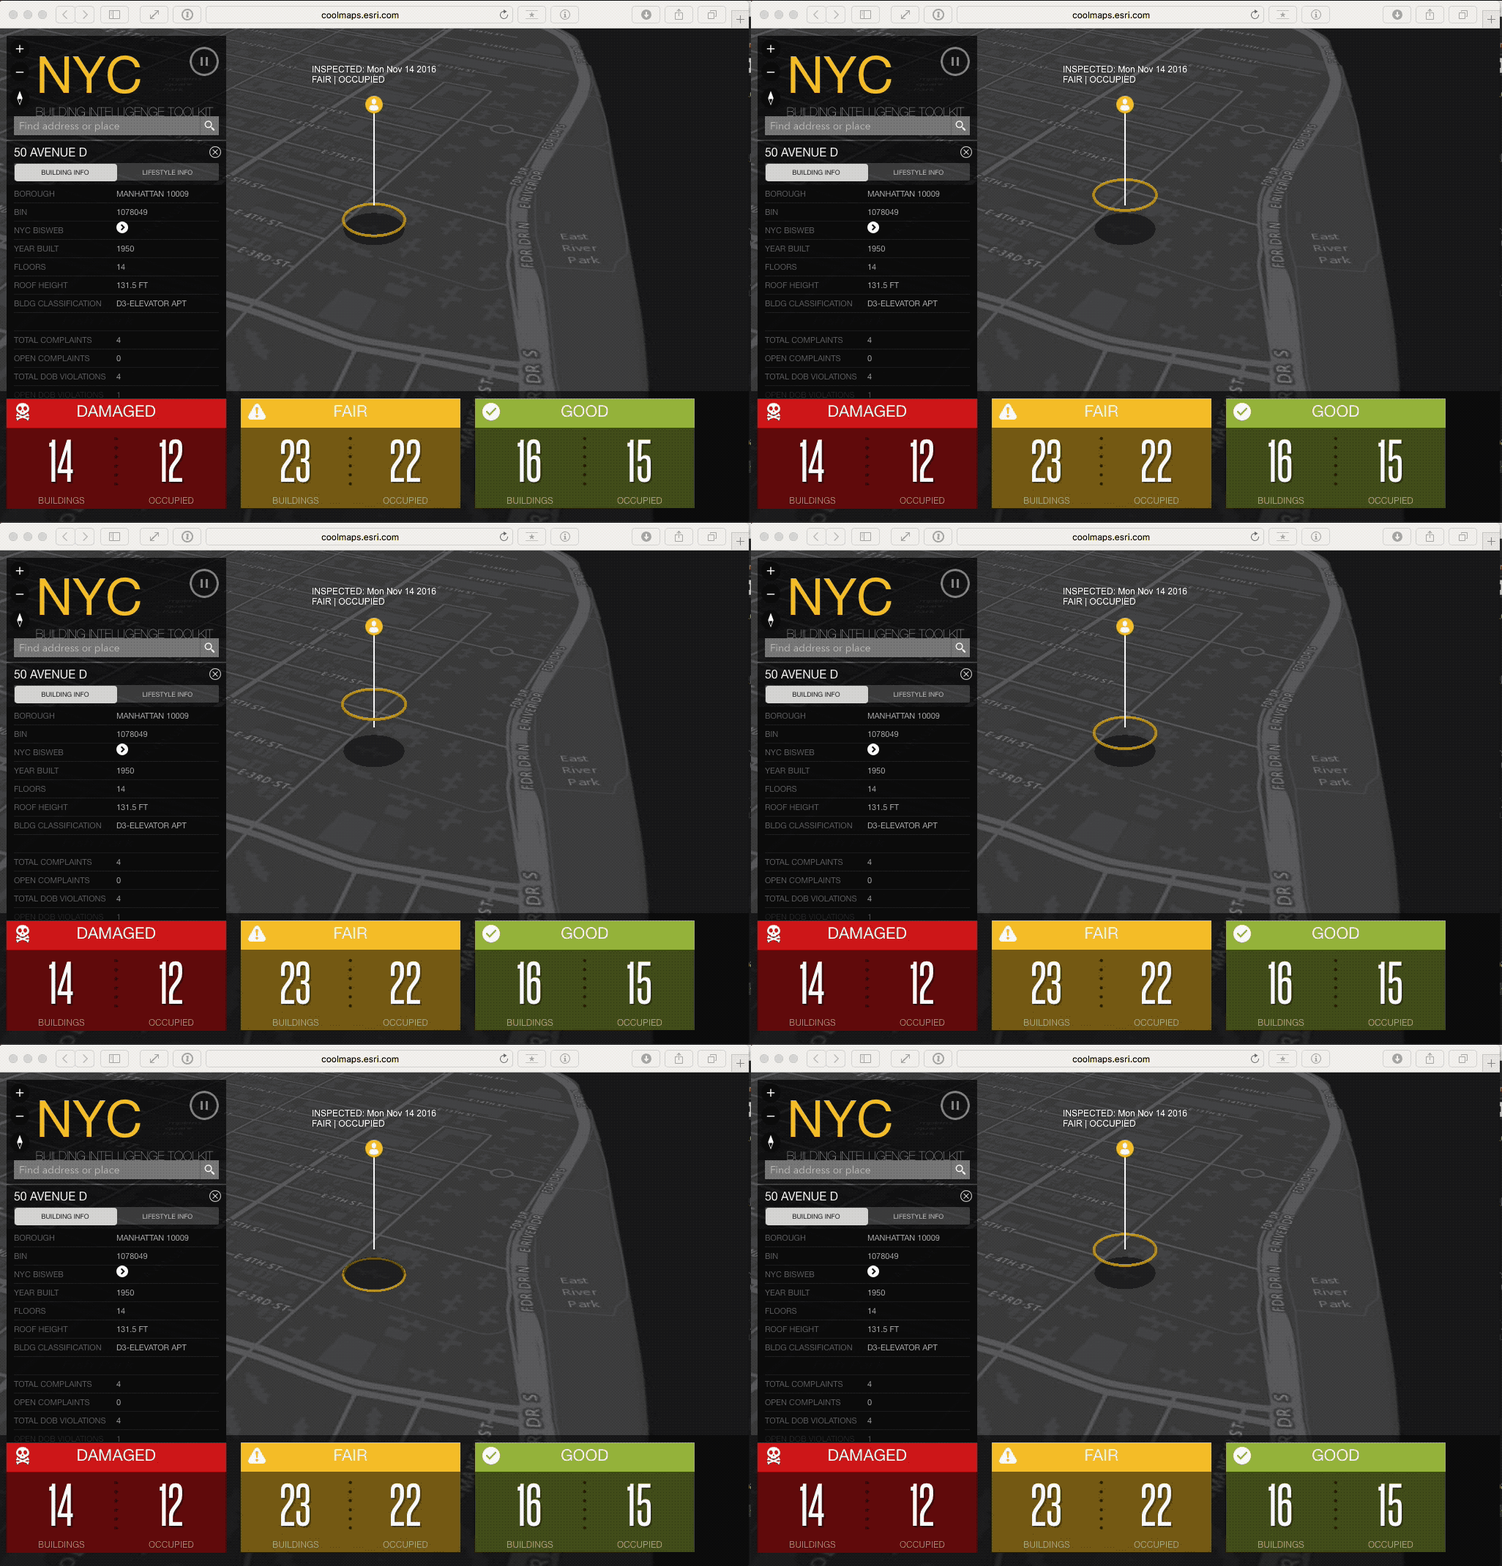
Building Intelligence Toolkit
Dashboard showing New York City building inspections performed in real-time using ArcGIS Collector.
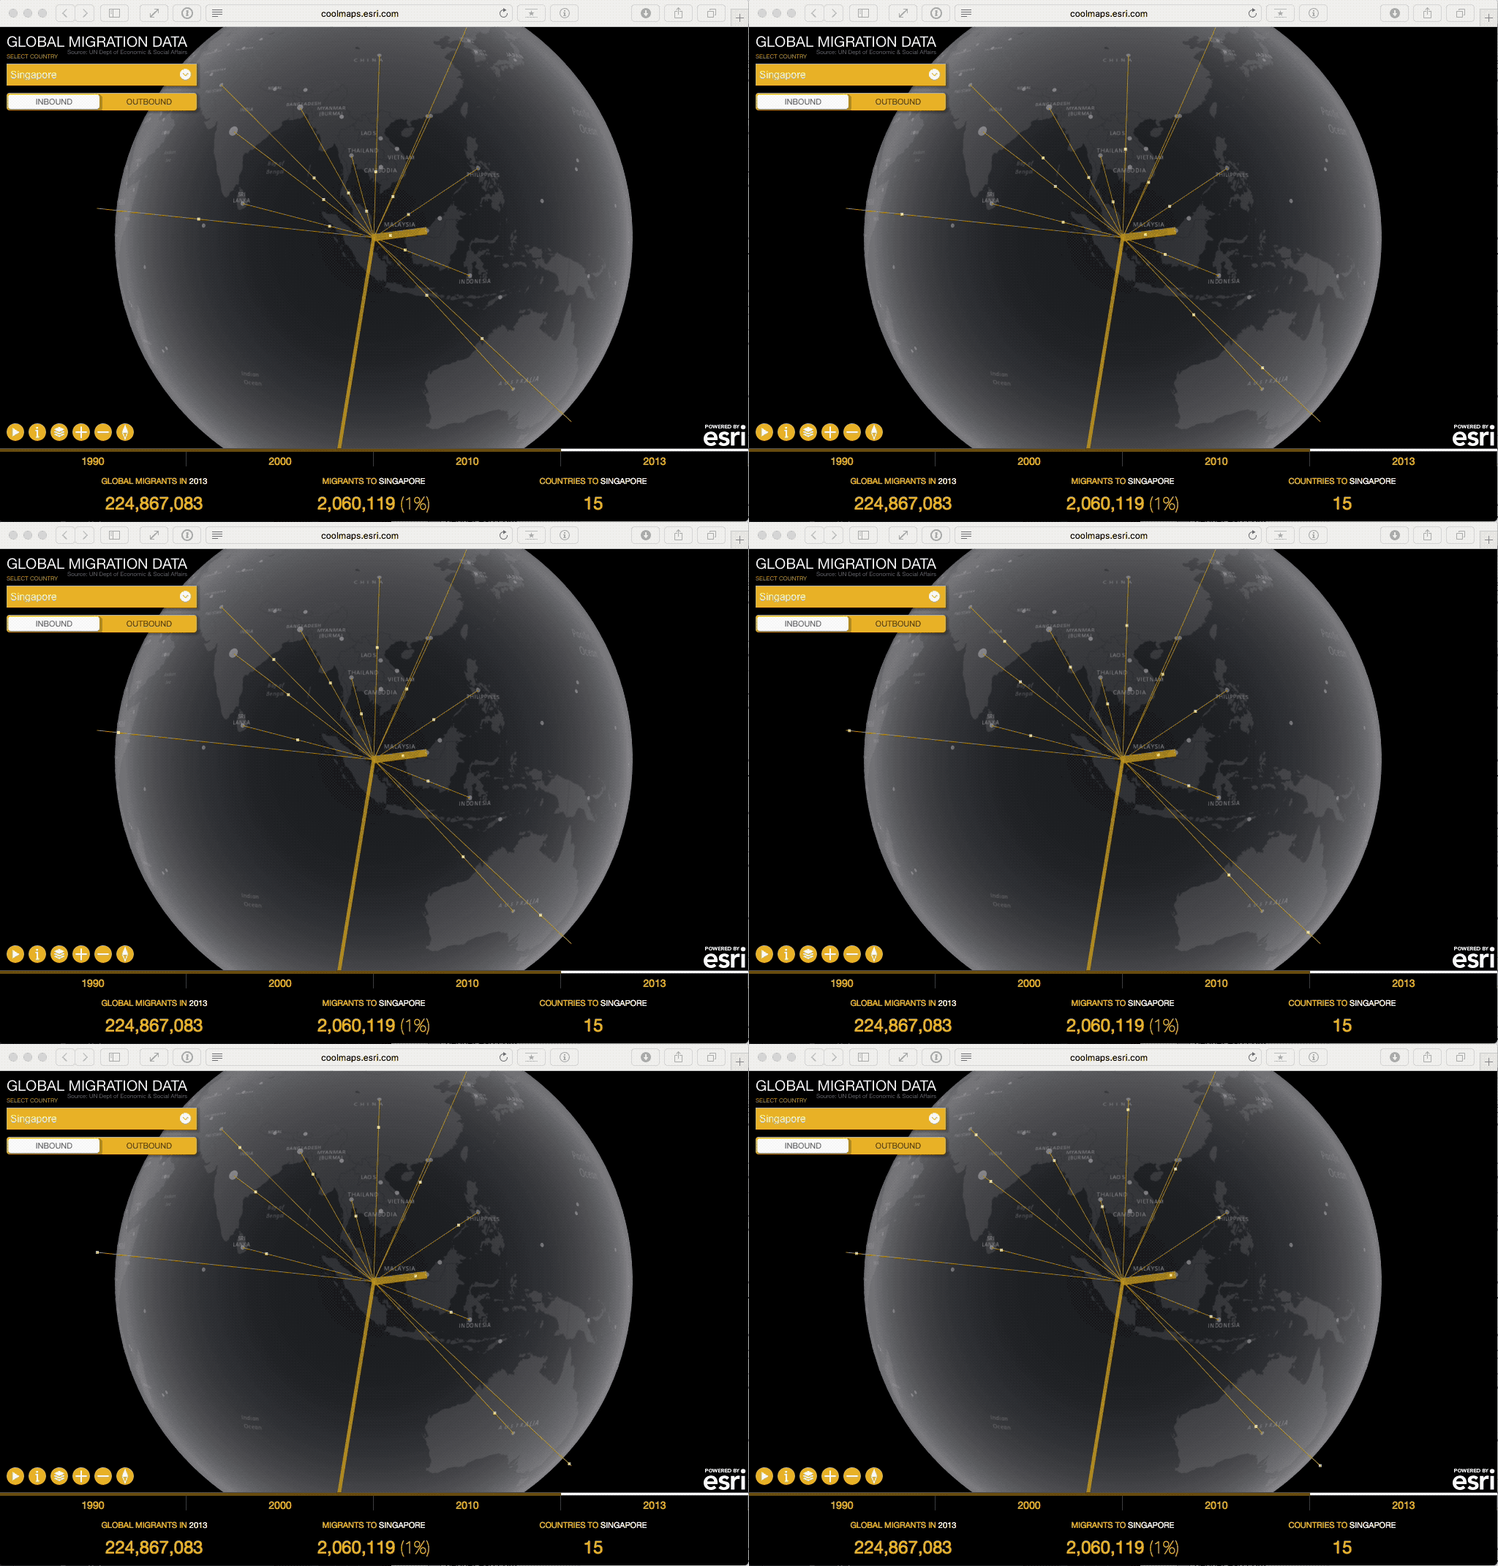
Migration Trends
This map presents estimates of the number of international migrants by destination and origin over time.
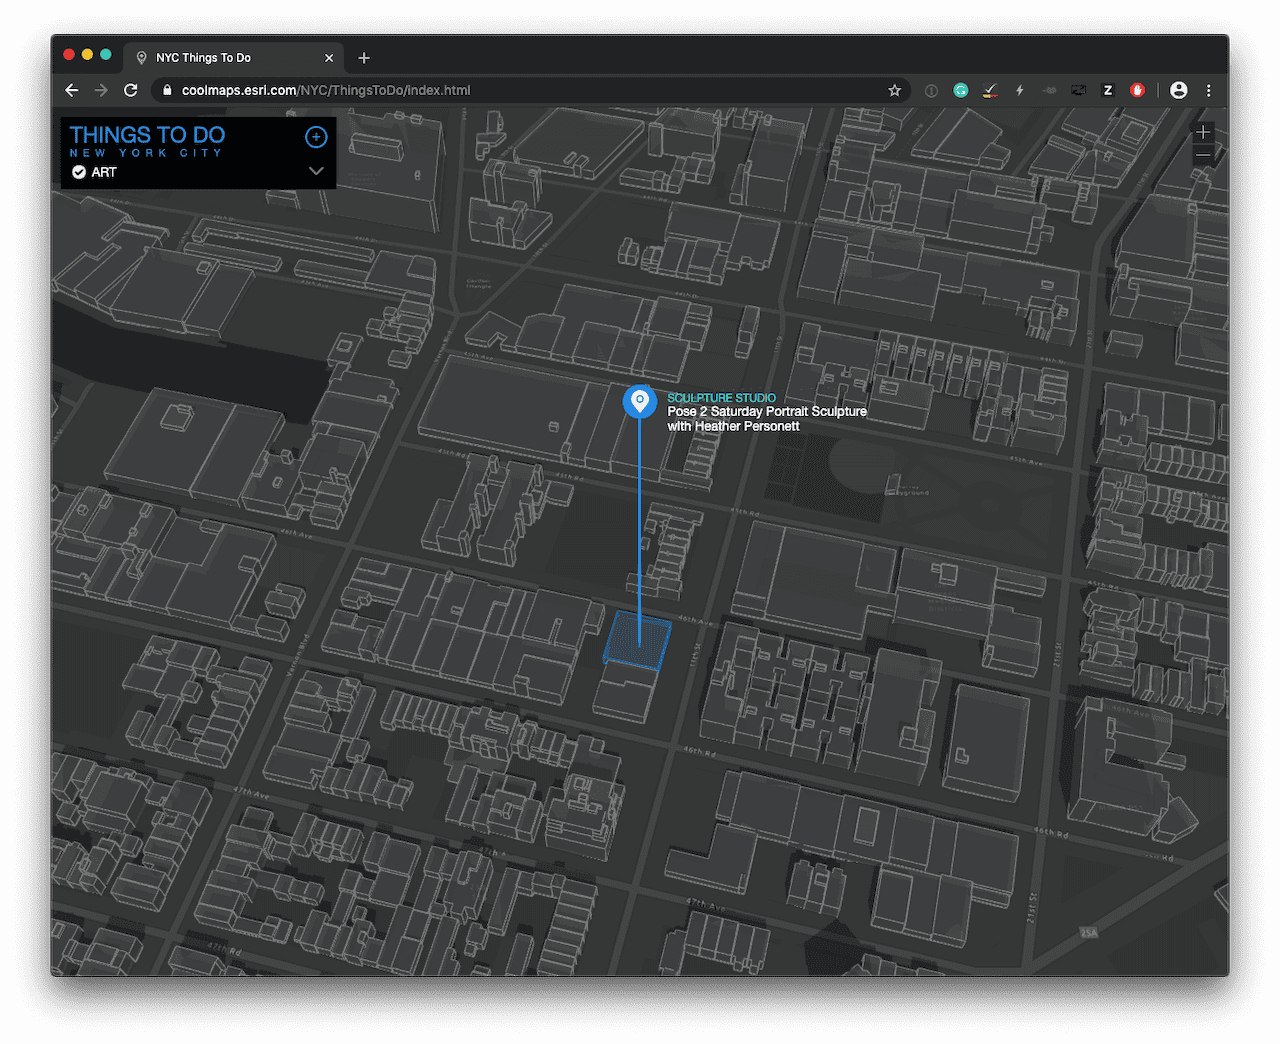
Things To Do
Explore things to do in NYC via an application that promotes bicycling and public transportation in New York City. The application uses Dijkstra’s algorithm to show the shortest path from the subway, bus stop and bike station to each event.
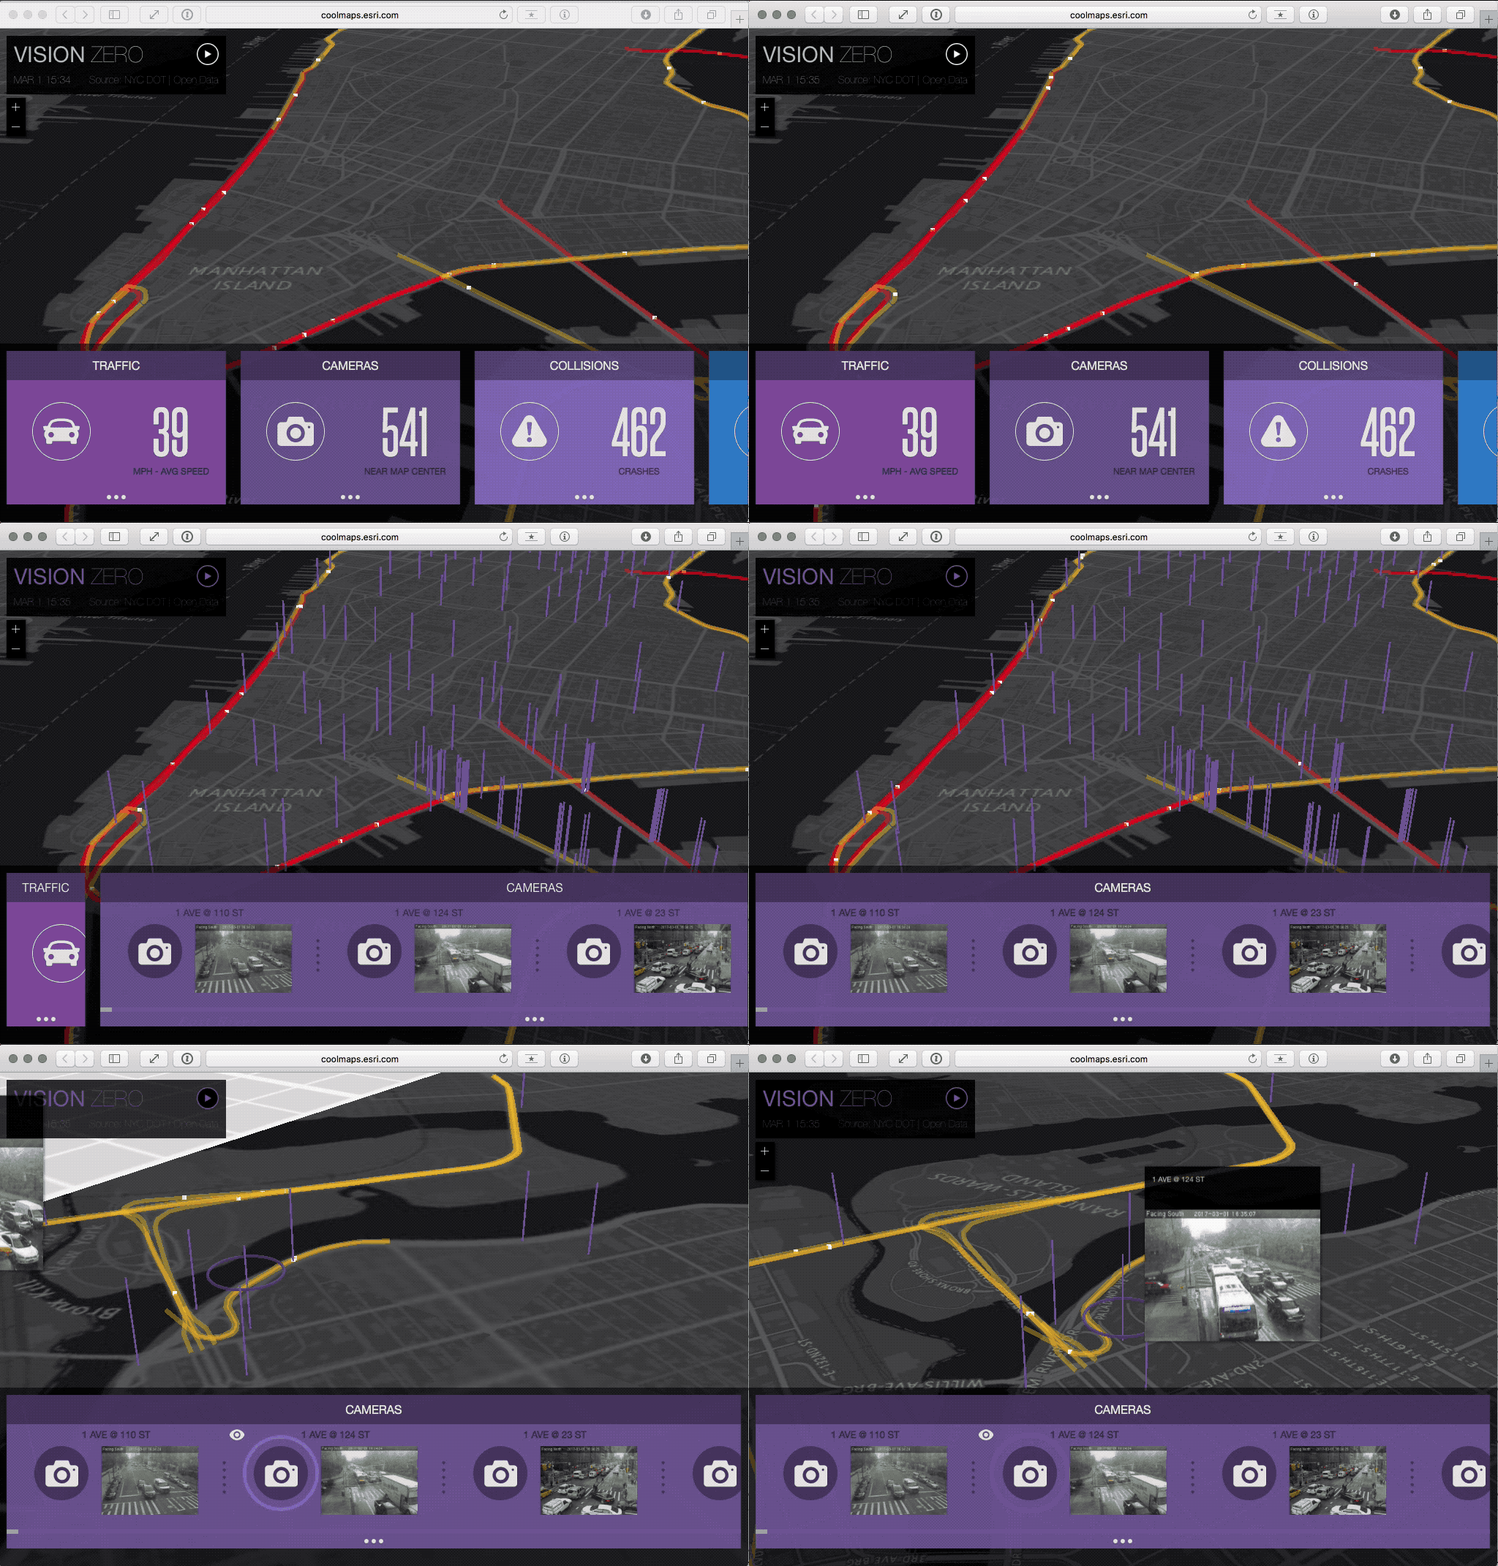
Vision Zero Dashboard
This map shows real-time traffic, accidents, traffic cameras, air quality and weather in New York City.
visualization
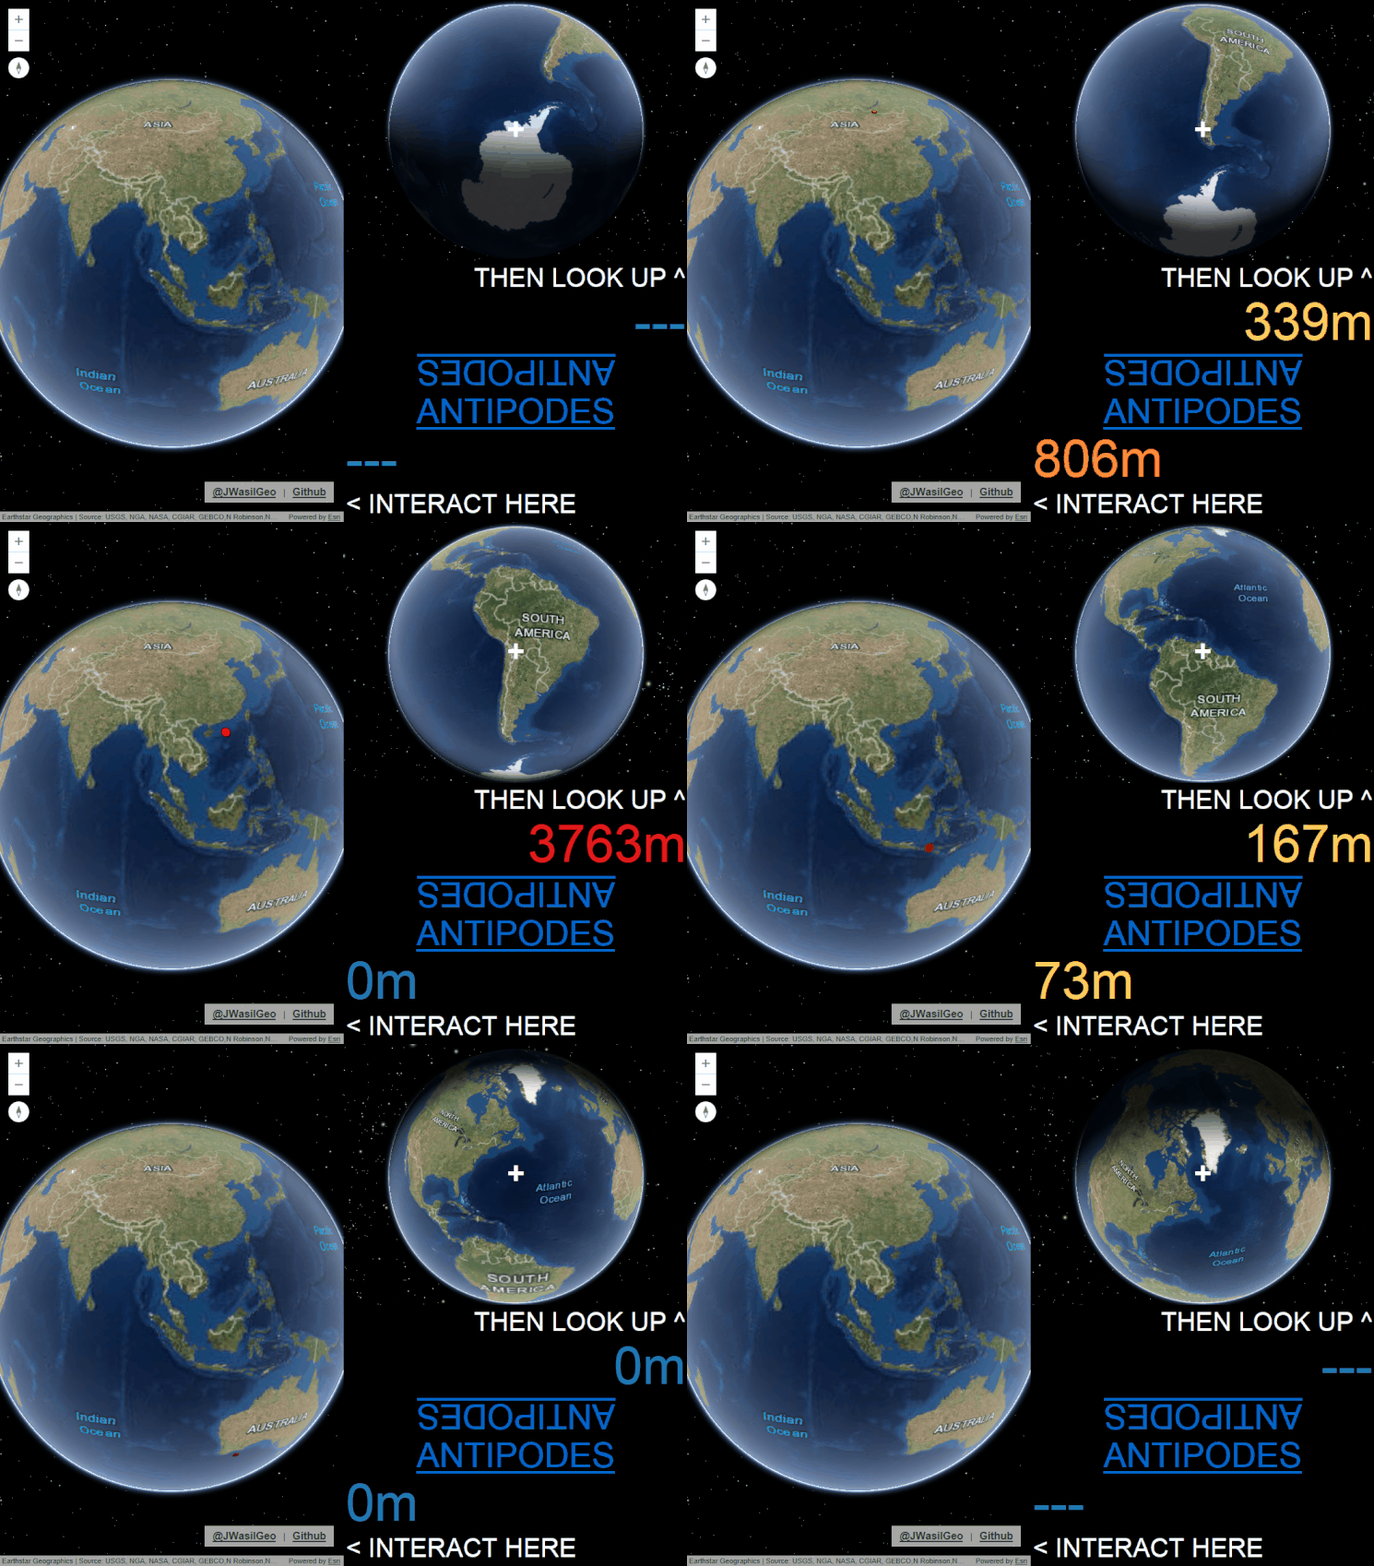
Antipodes
Get to know the opposite side of the Earth.
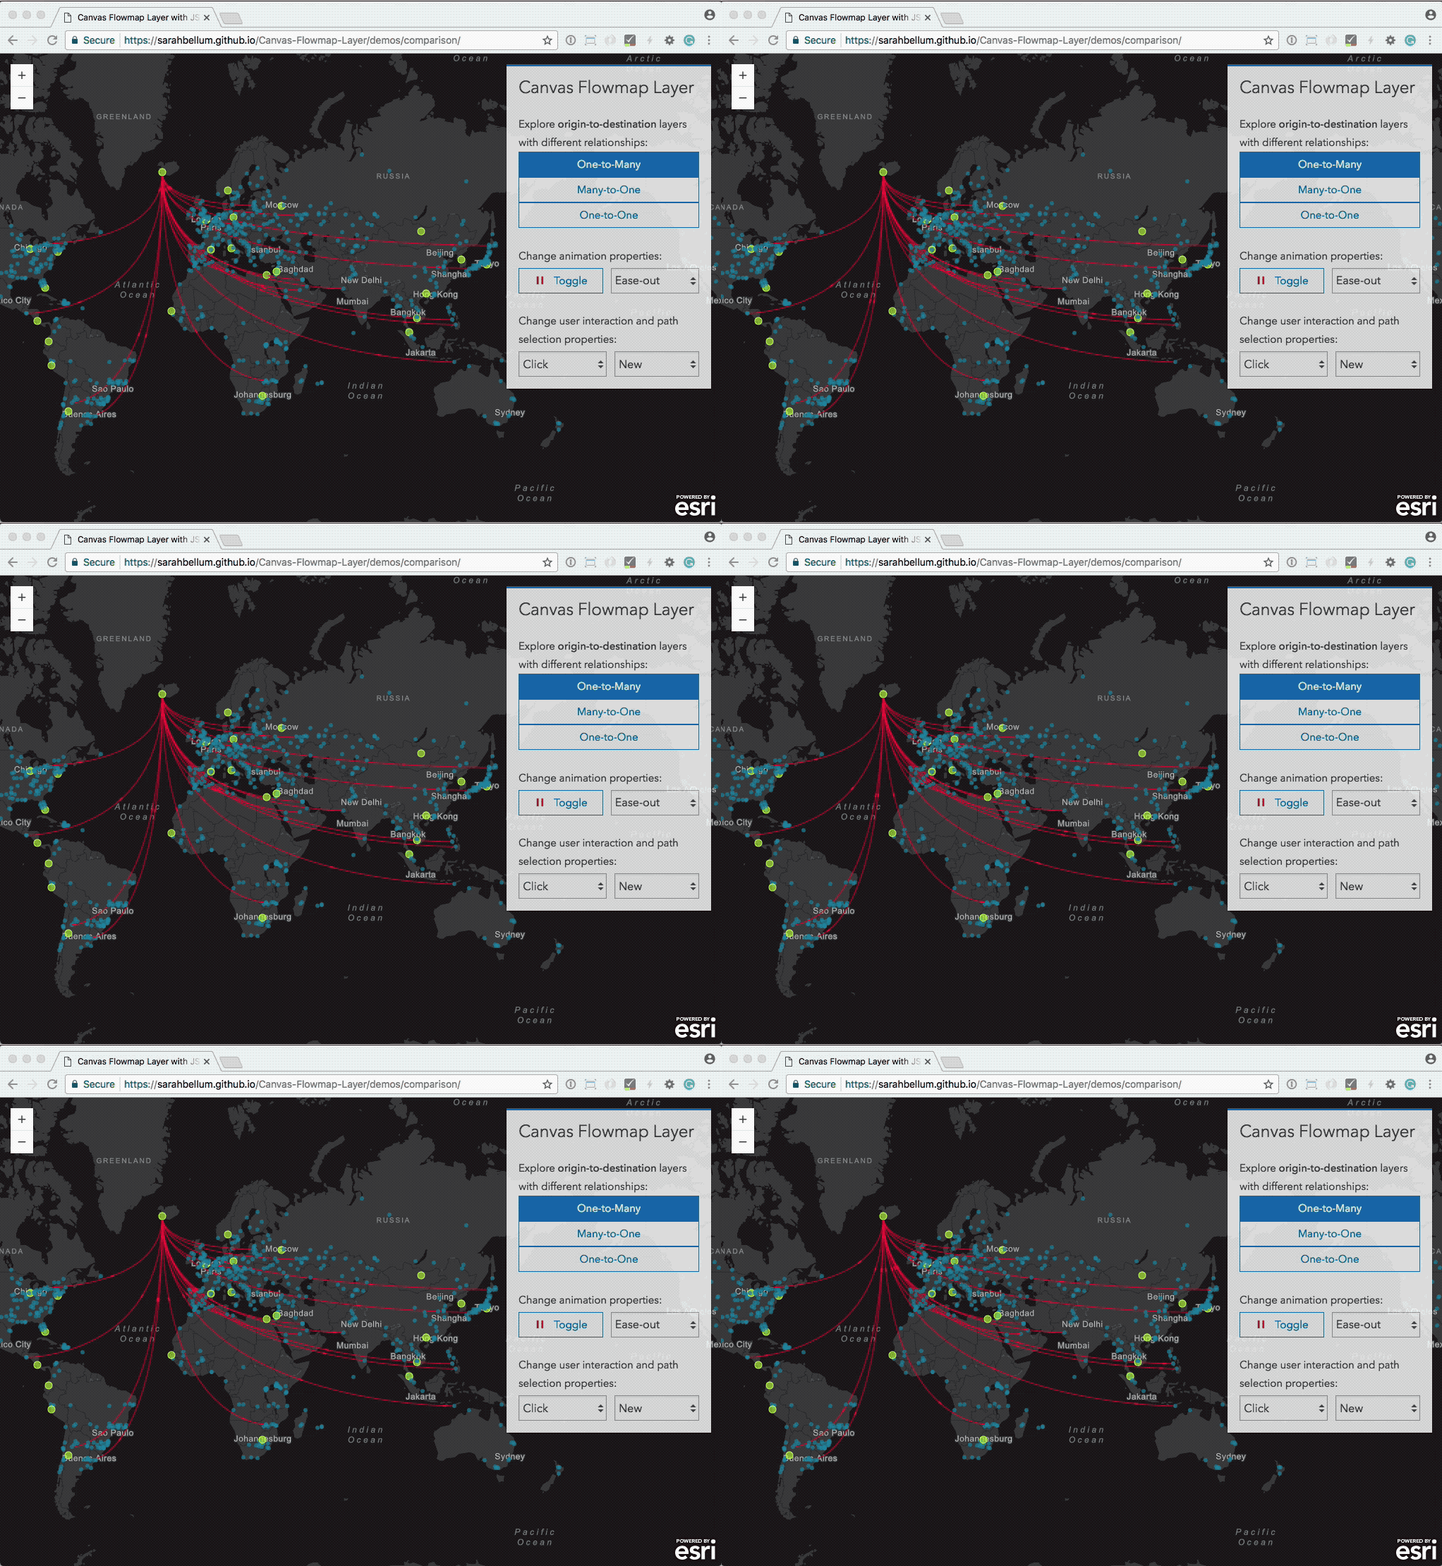
Canvas Flowmap Layer
Canvas-Flowmap-Layer, an extension of the ArcGIS API for JavaScript (Esri JSAPI) for the purpose of mapping the flow of objects from an origin point to a destination point by using a Bezier curve.
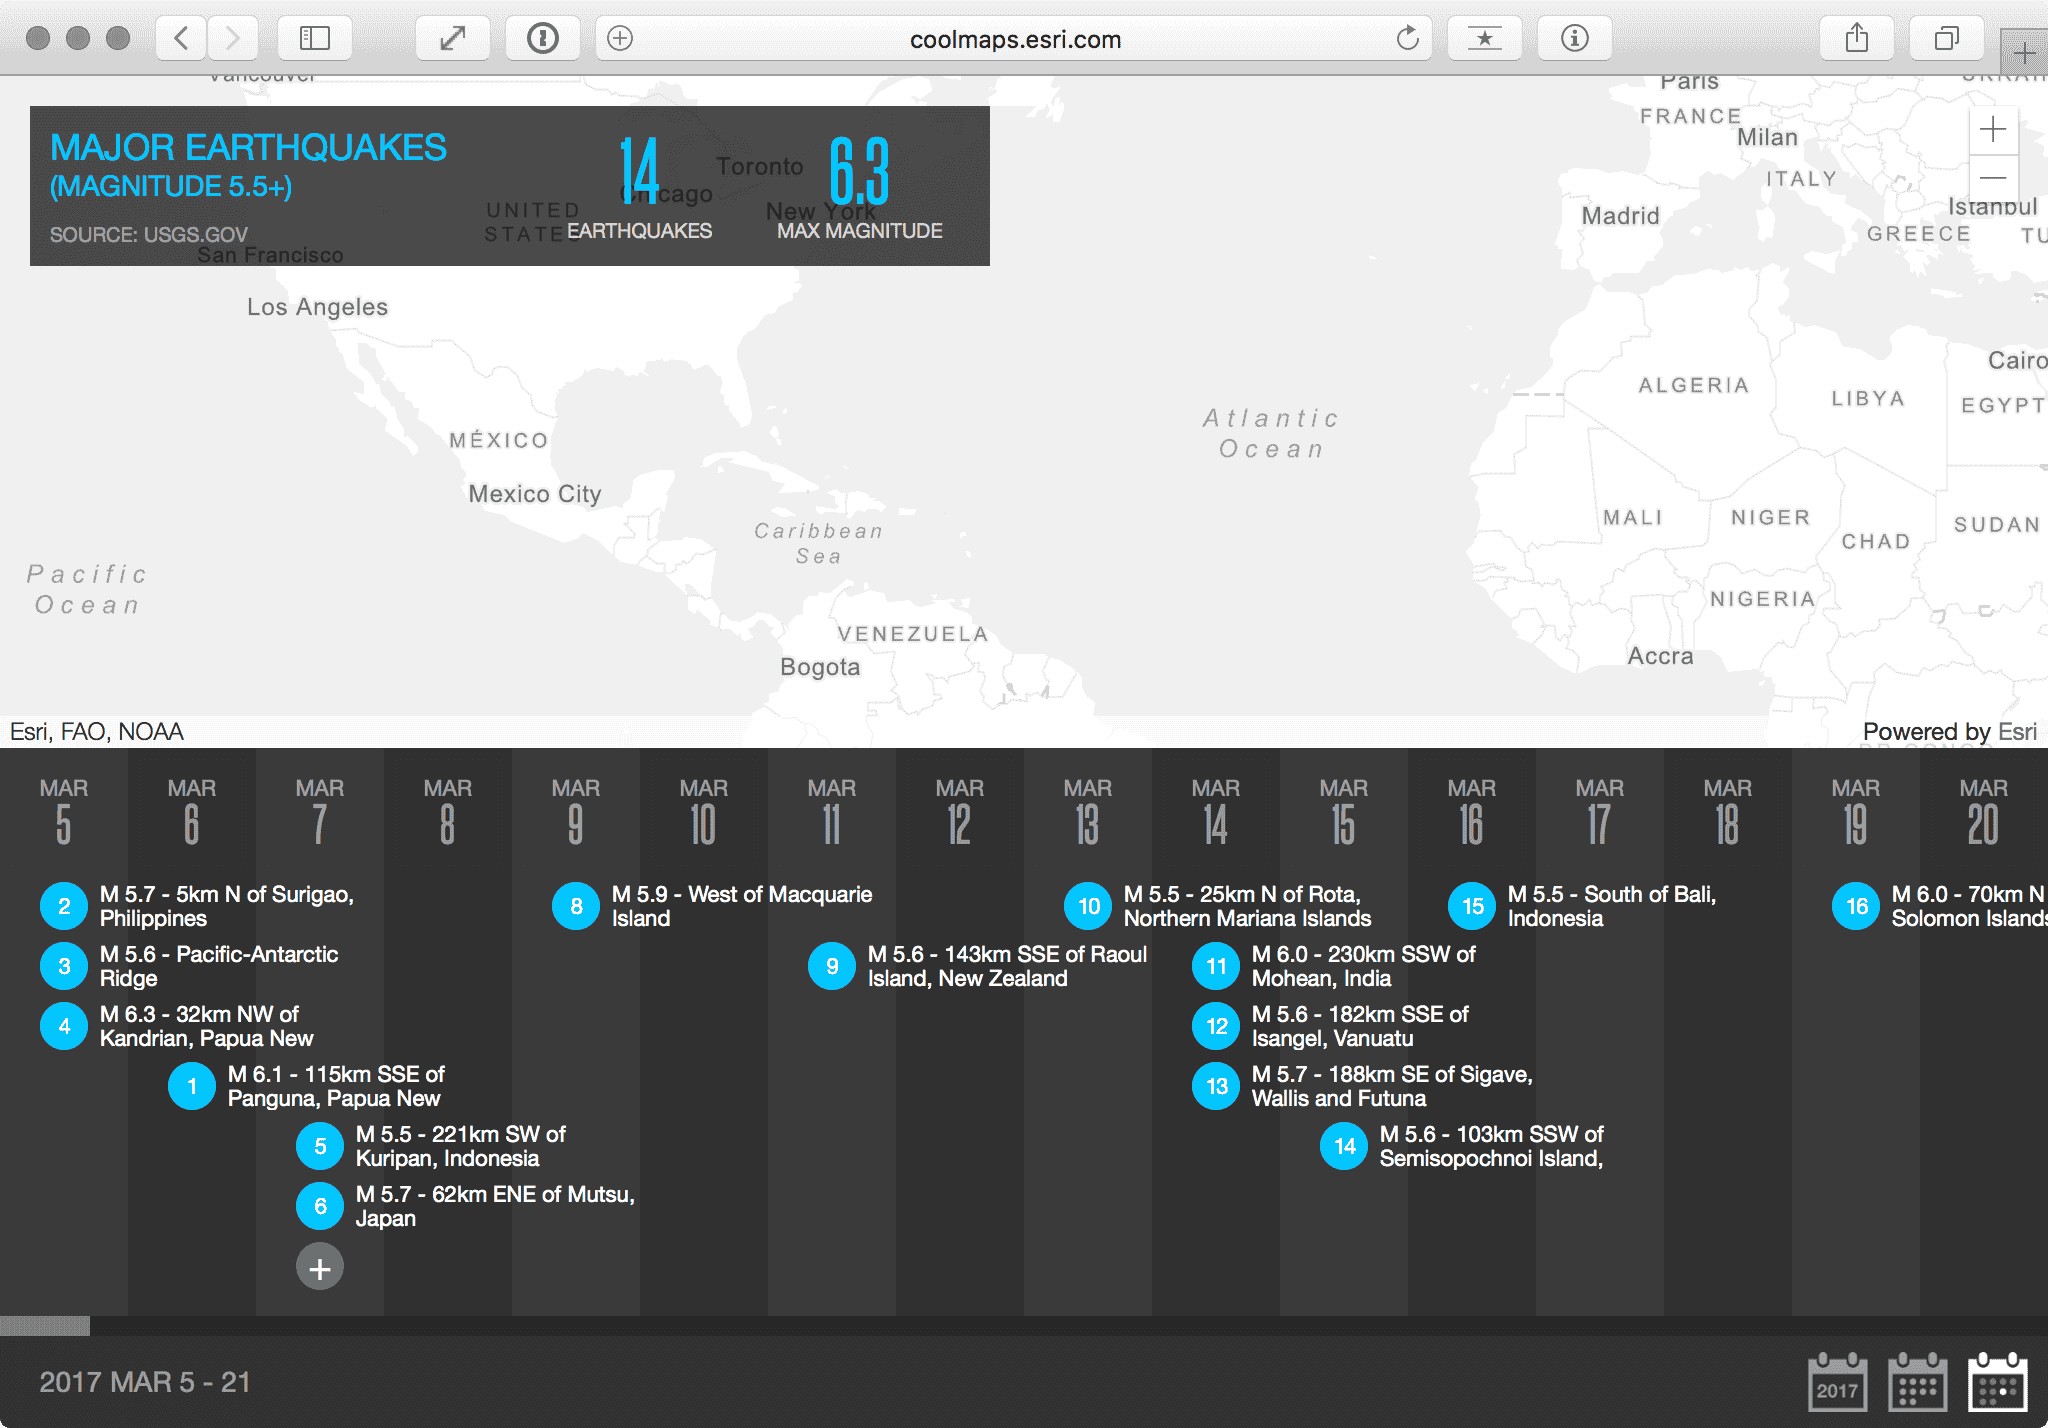
Chrono
Mapping earthquakes by year, month, day, hour and minute.
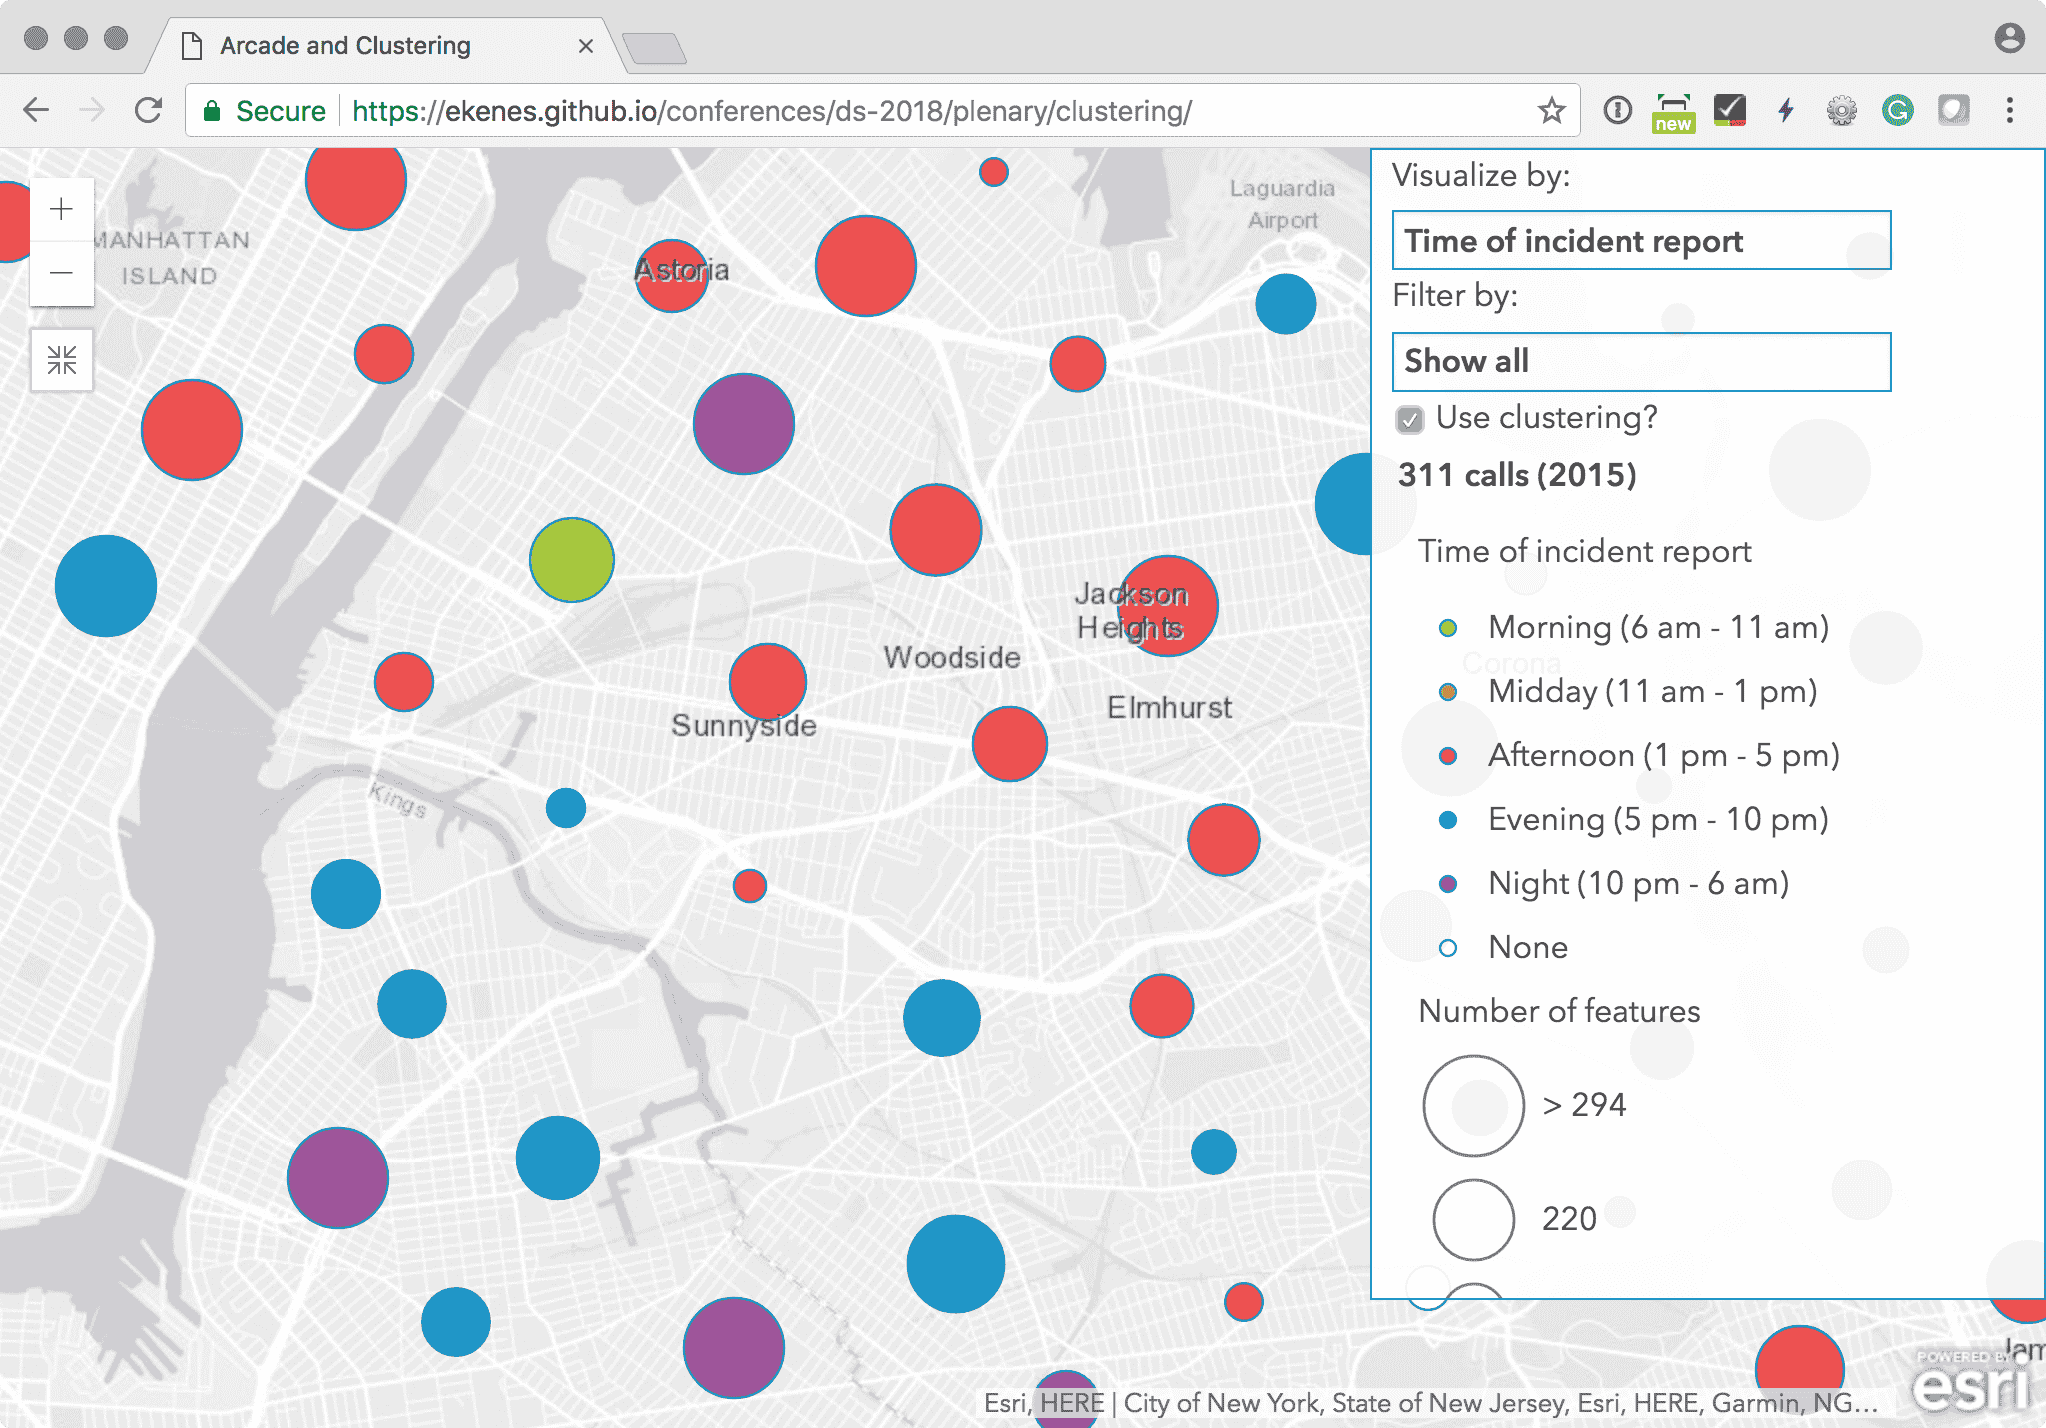
Explore 311 Calls in NYC
Use clustering to explore 50,000 311 calls in NYC.
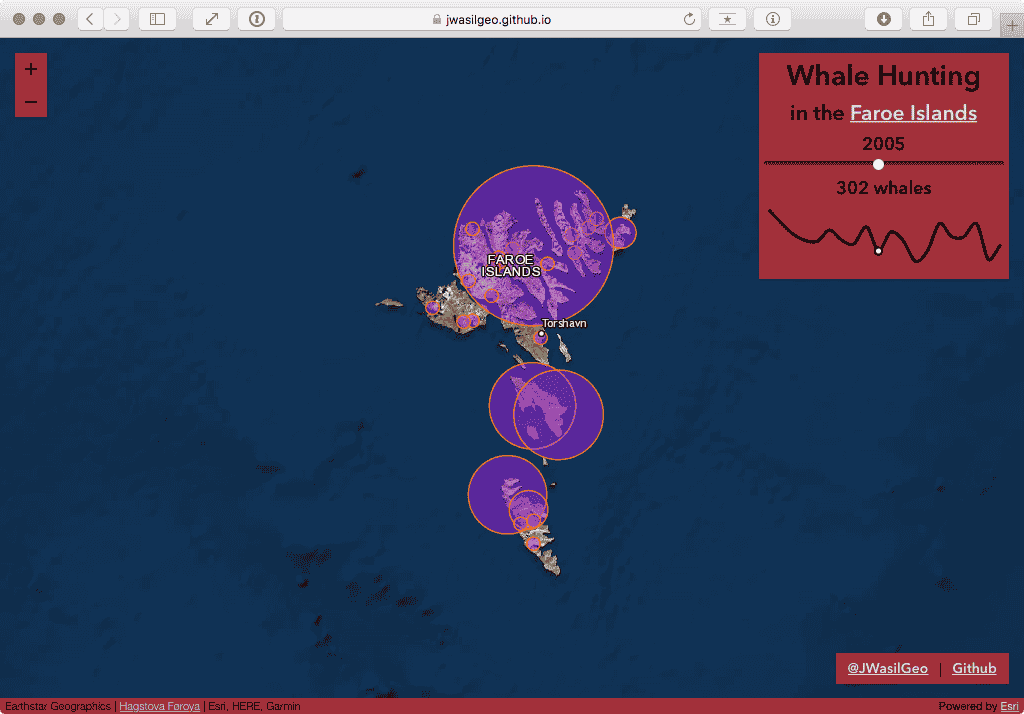
Faroe Islands Whaling
Explore whale hunting throughout the Faroe Islands on a map.
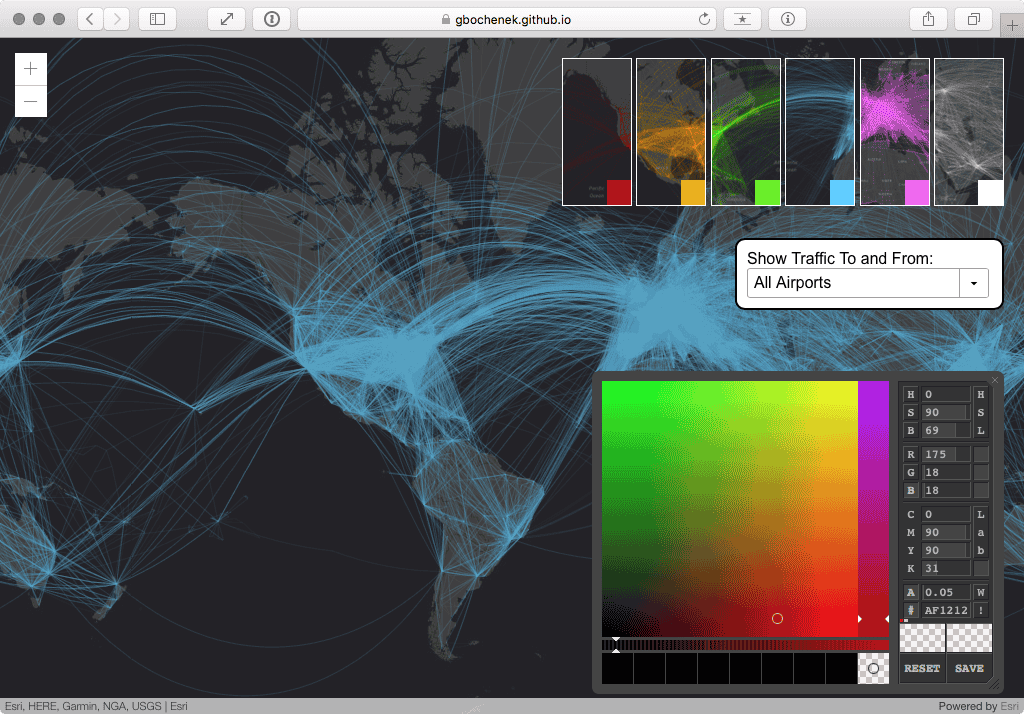
Flight Paths
A theme for Bootstrap for designing, styling and creating modern map apps.
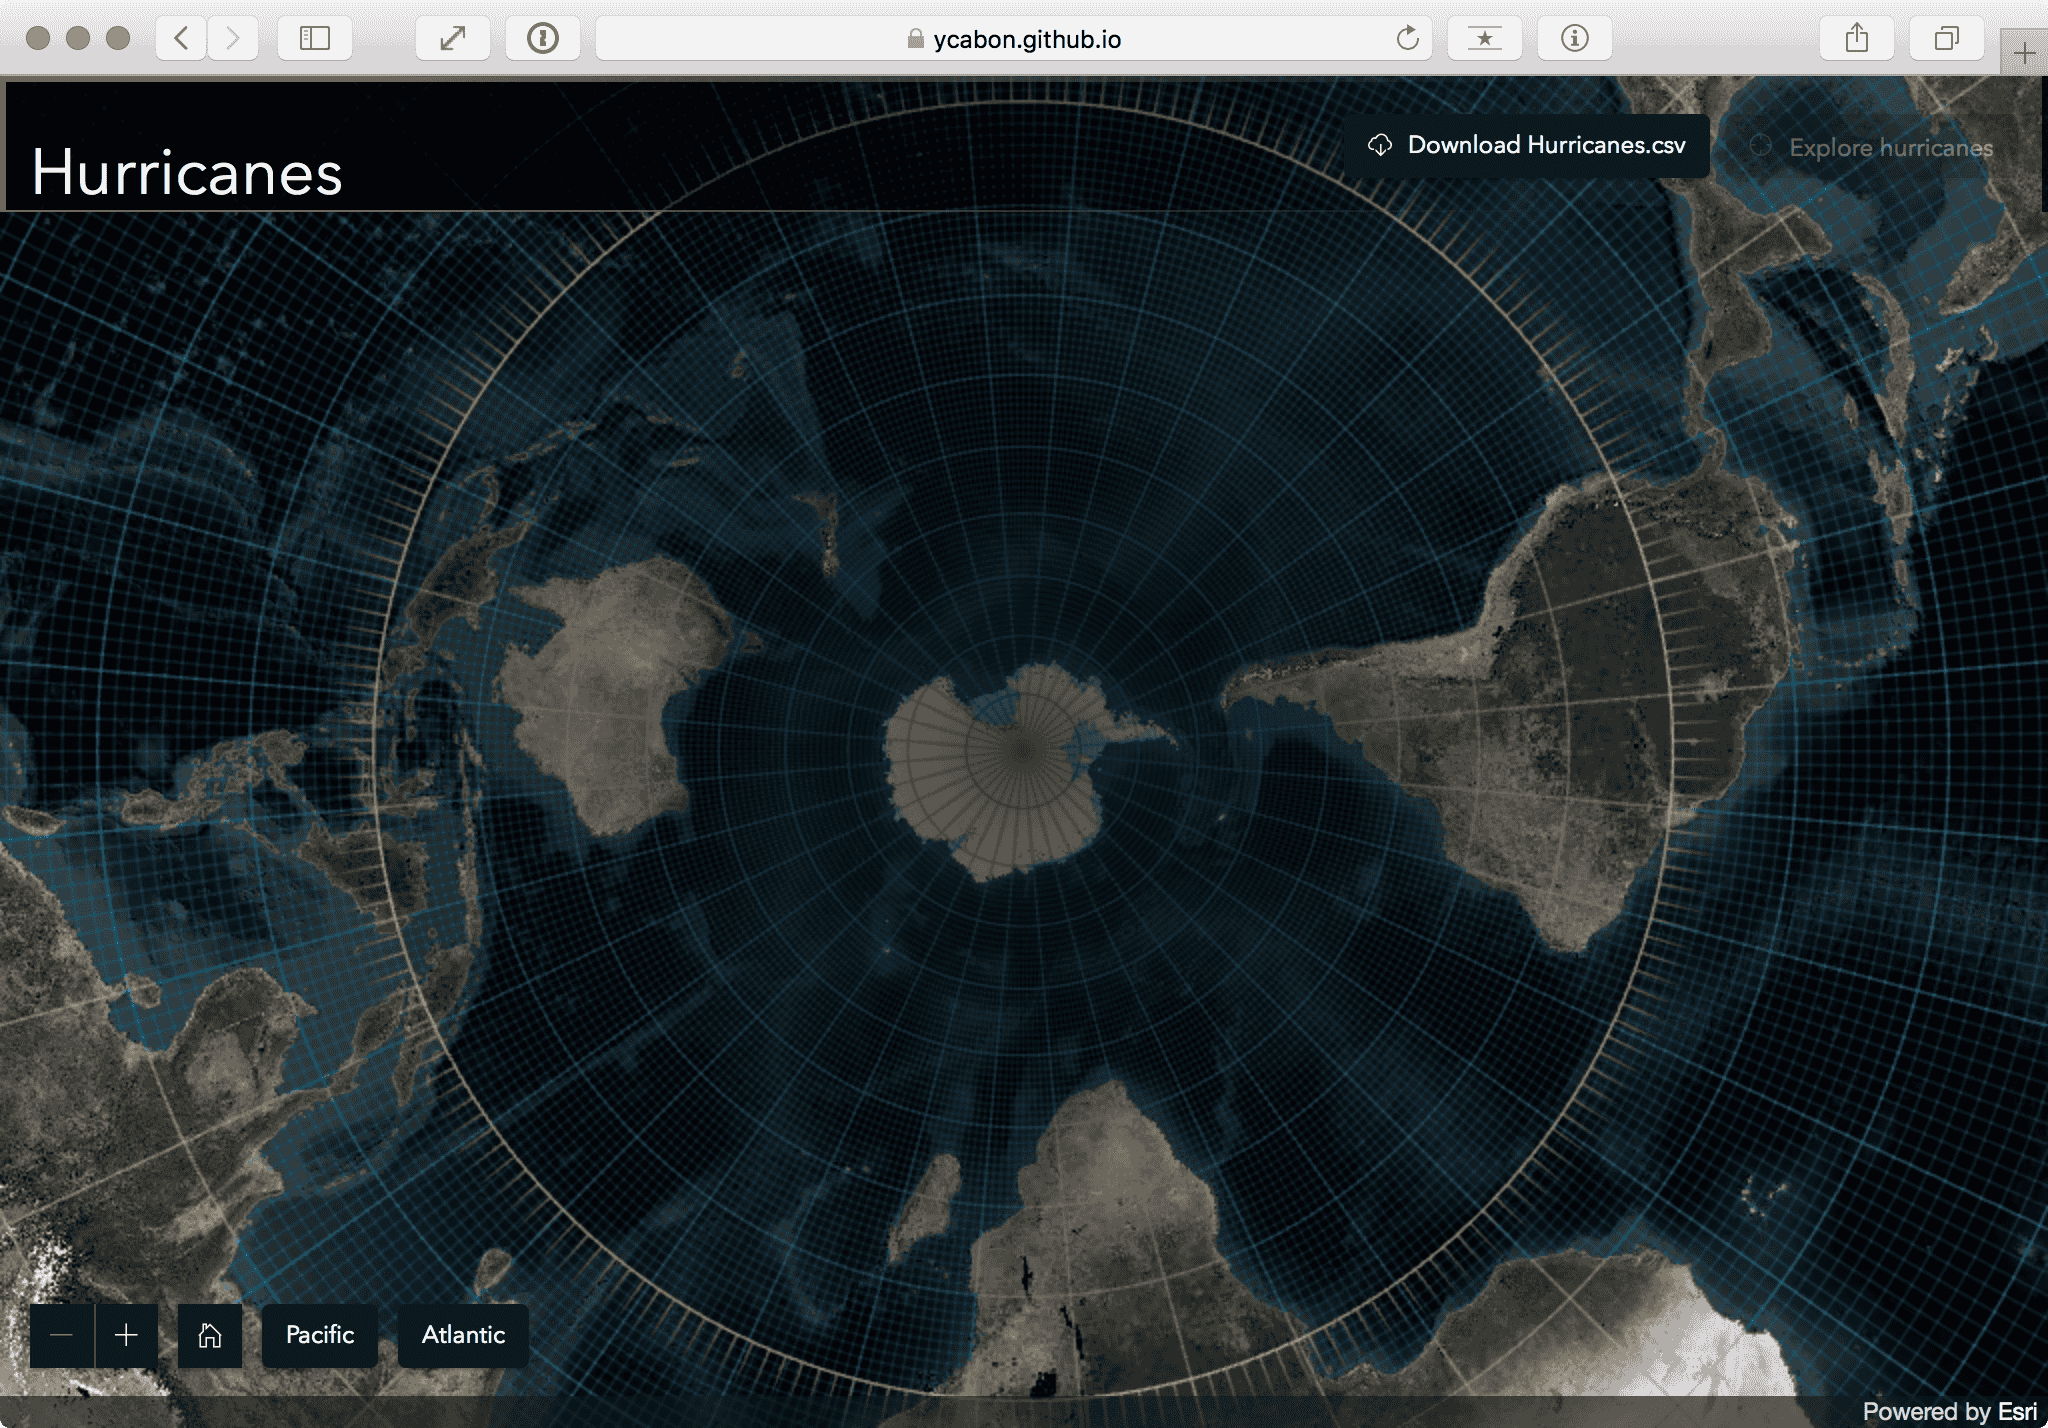
Hurricanes
Hurricanes
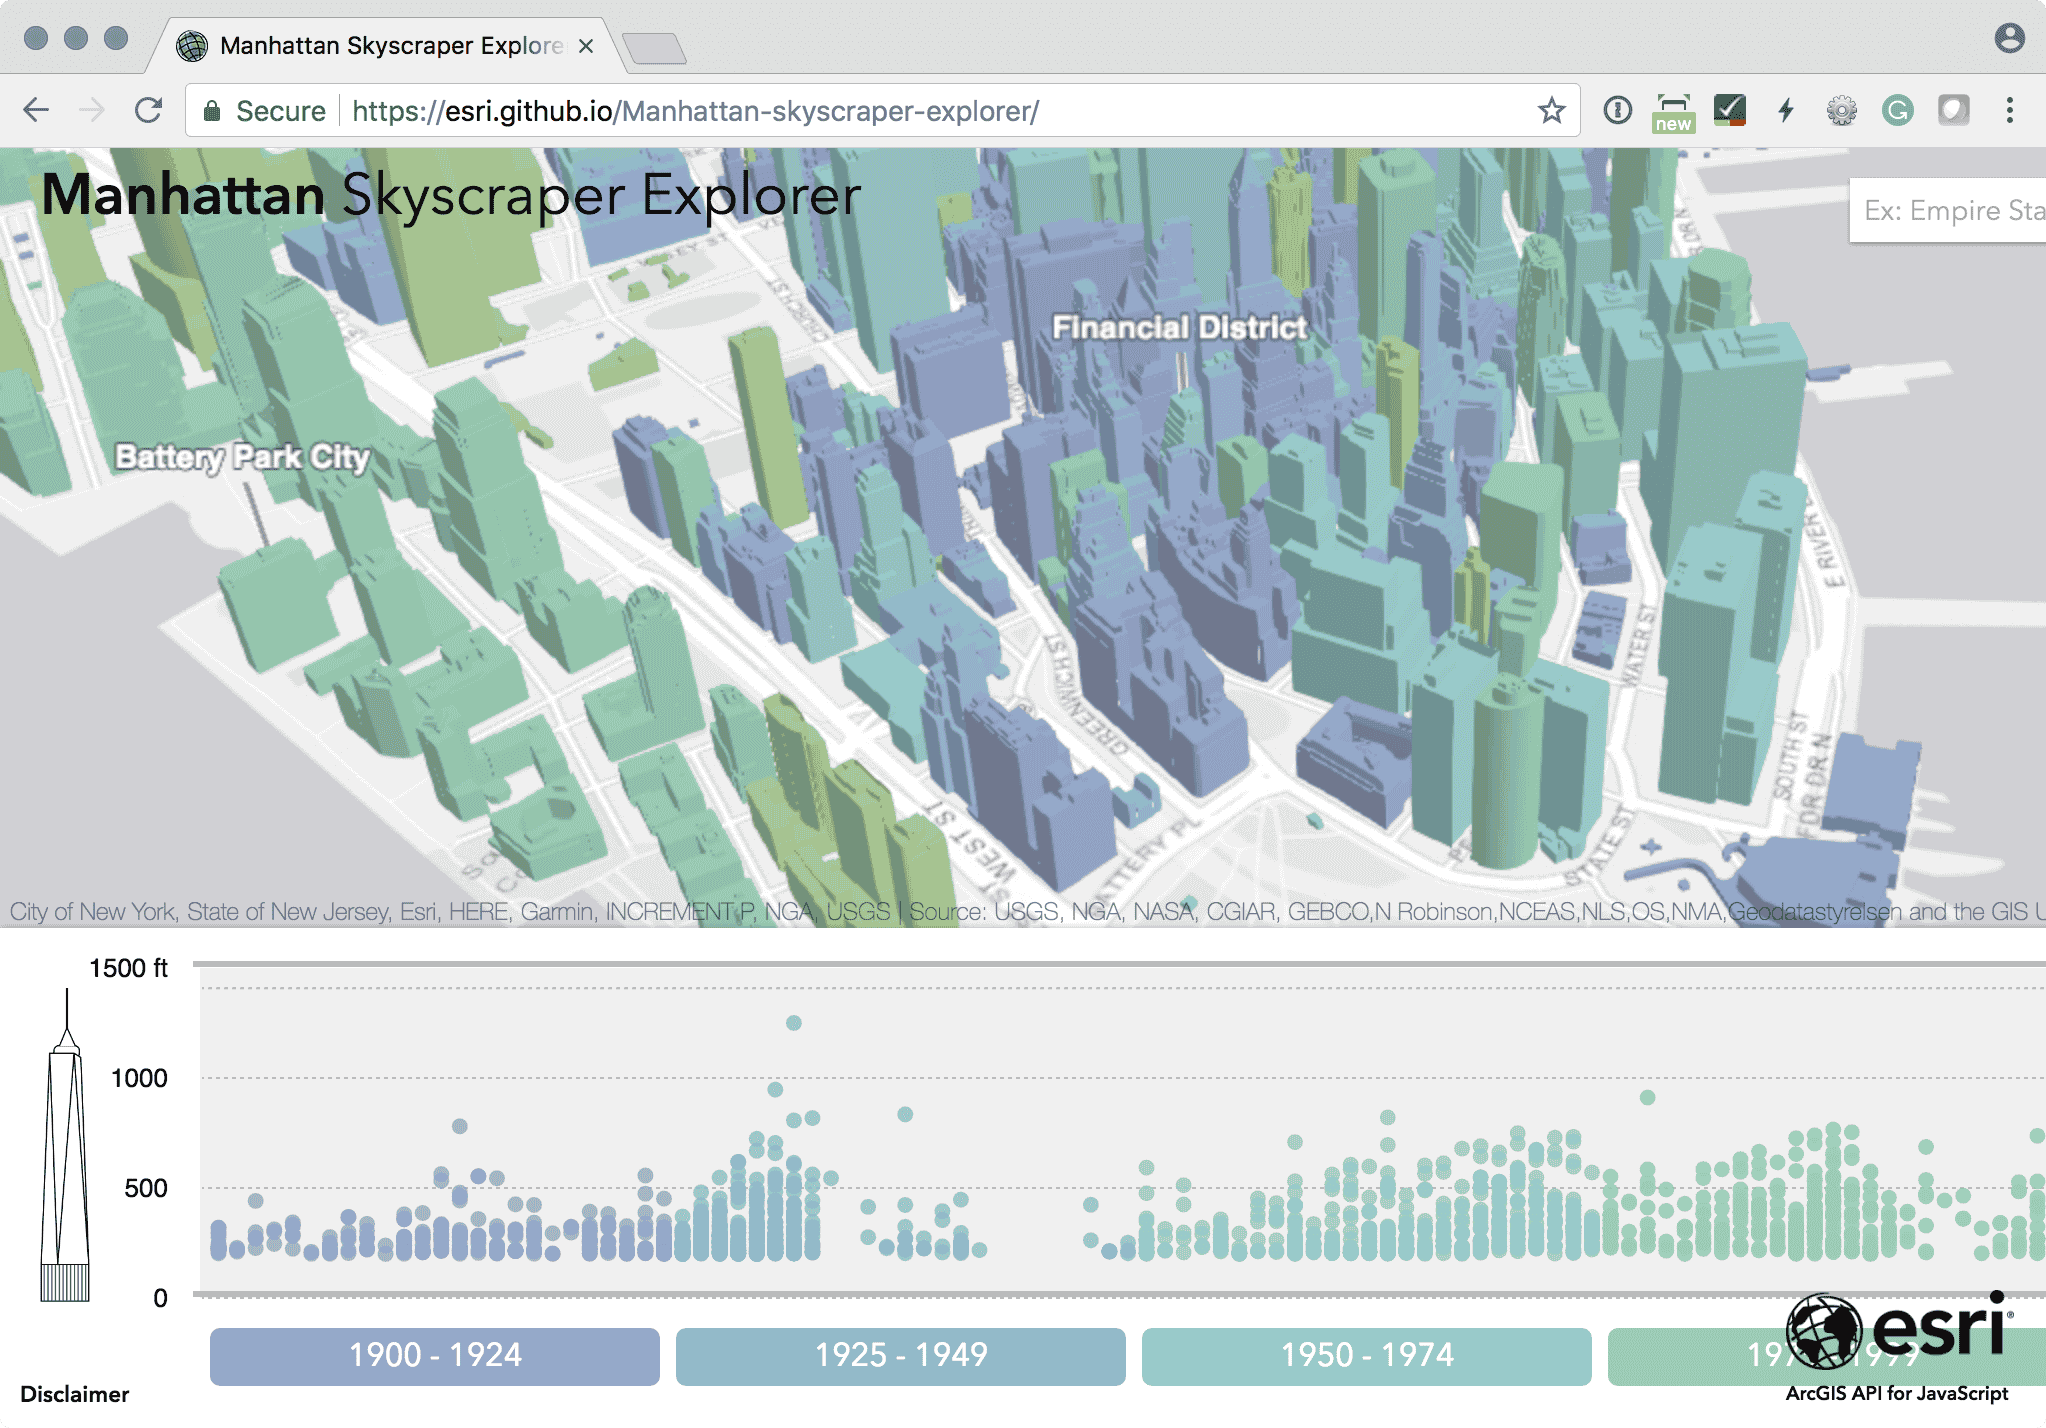
Manhattan Skyscraper Explorer
An Exploration of building in the Manhattan area over time.
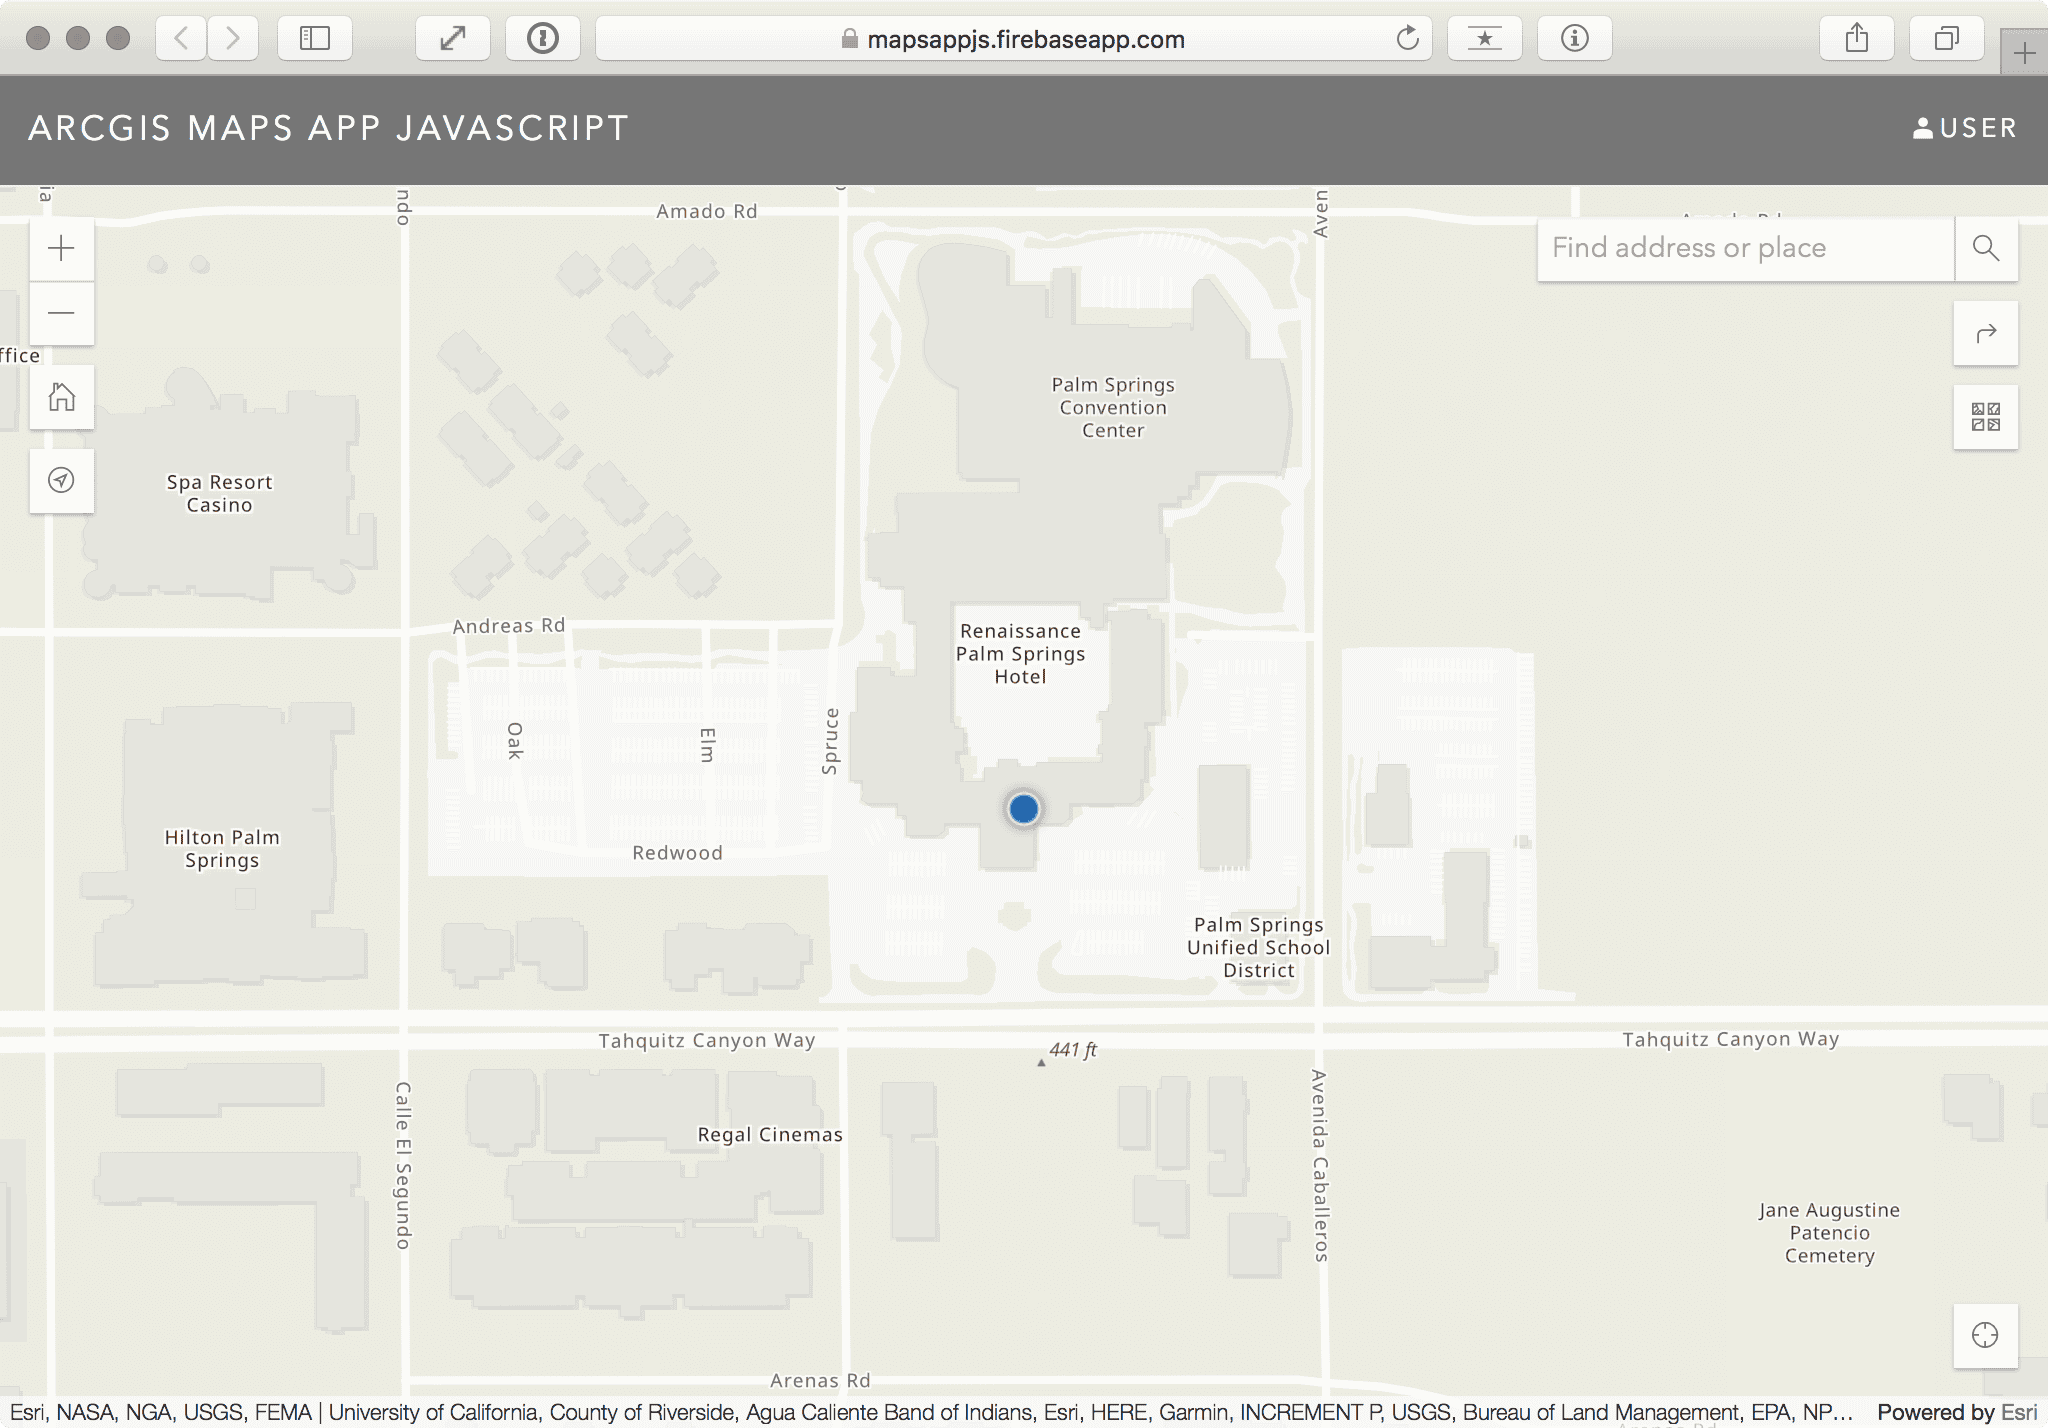
Maps App JavaScript
Your organization's mapping app built with the ArcGIS API for JavaScript.
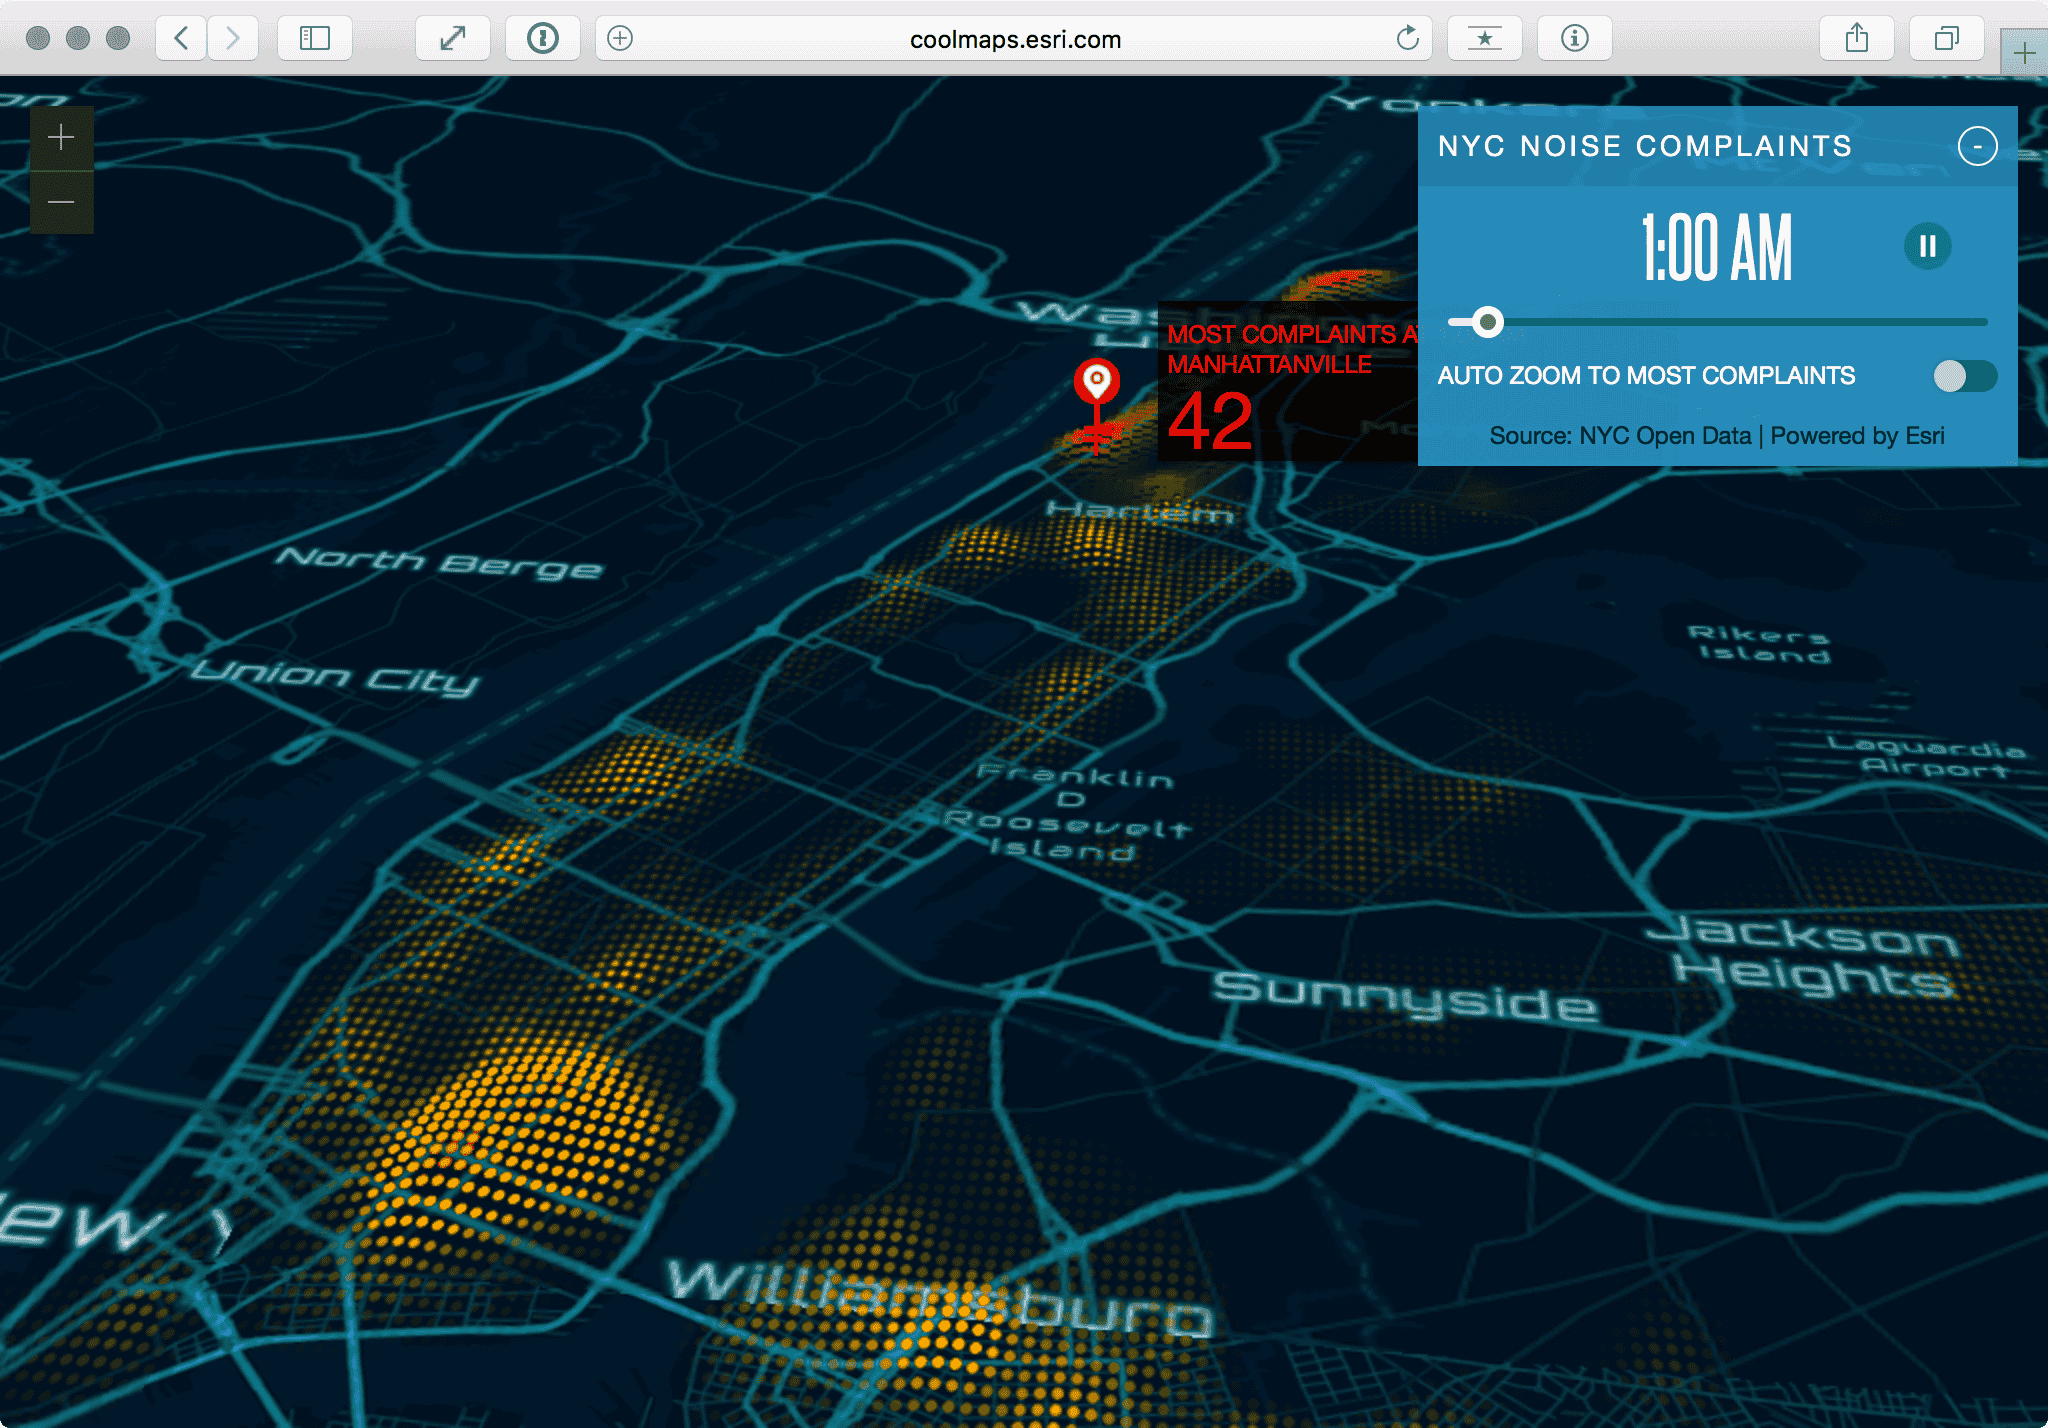
NYC Noise Complaints
Pinhead map helps visualize New York City noise complaints by time of day.
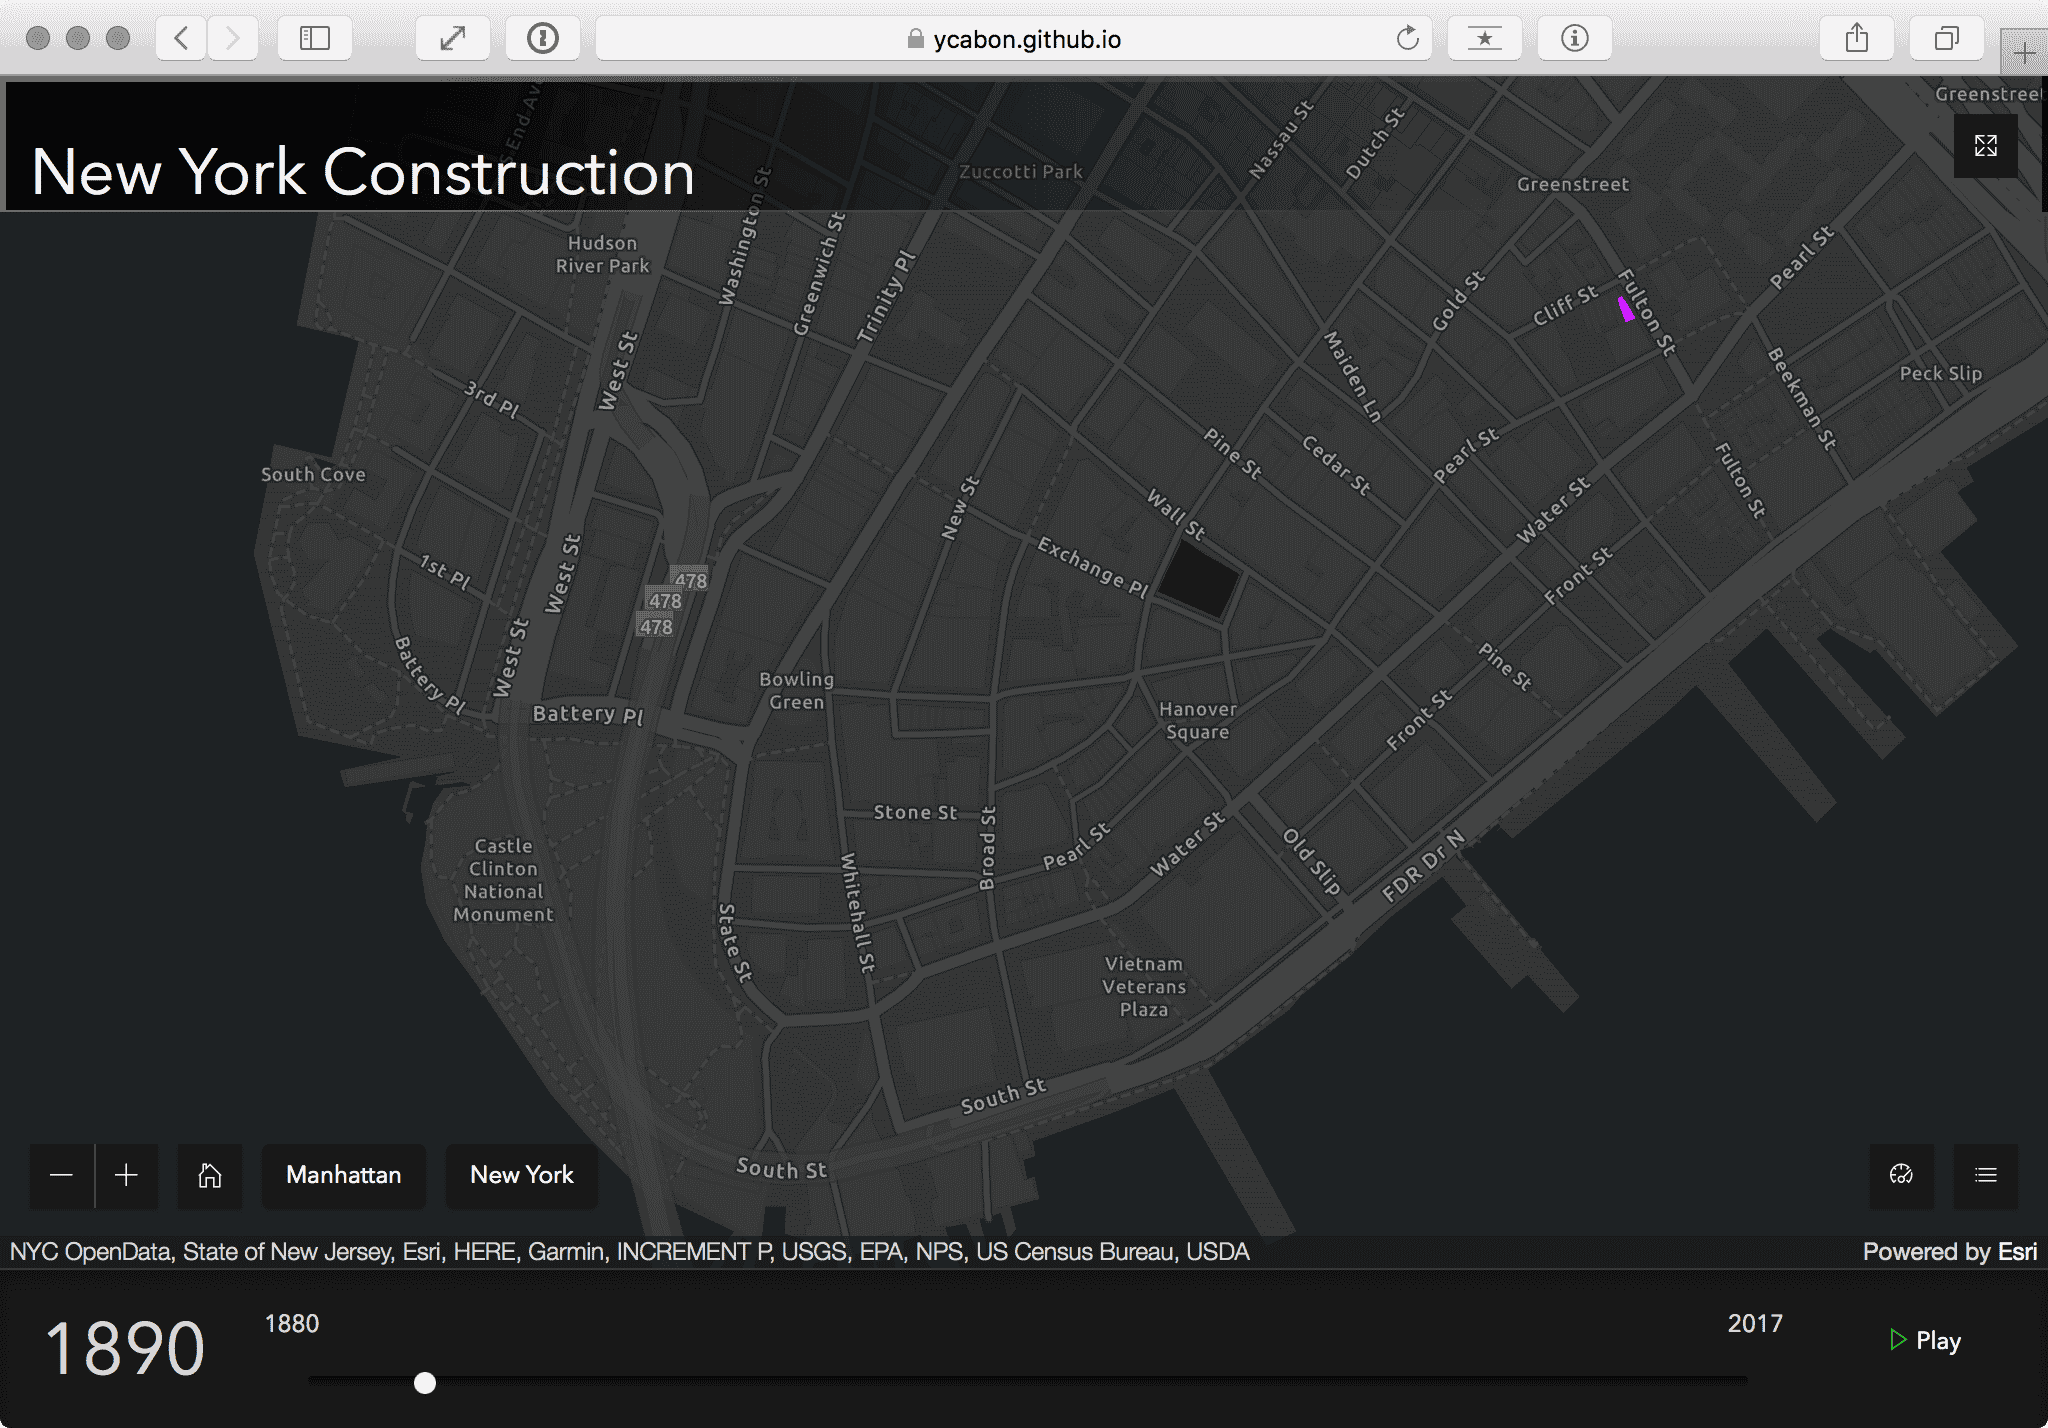
New York Buildings
New York Buildings
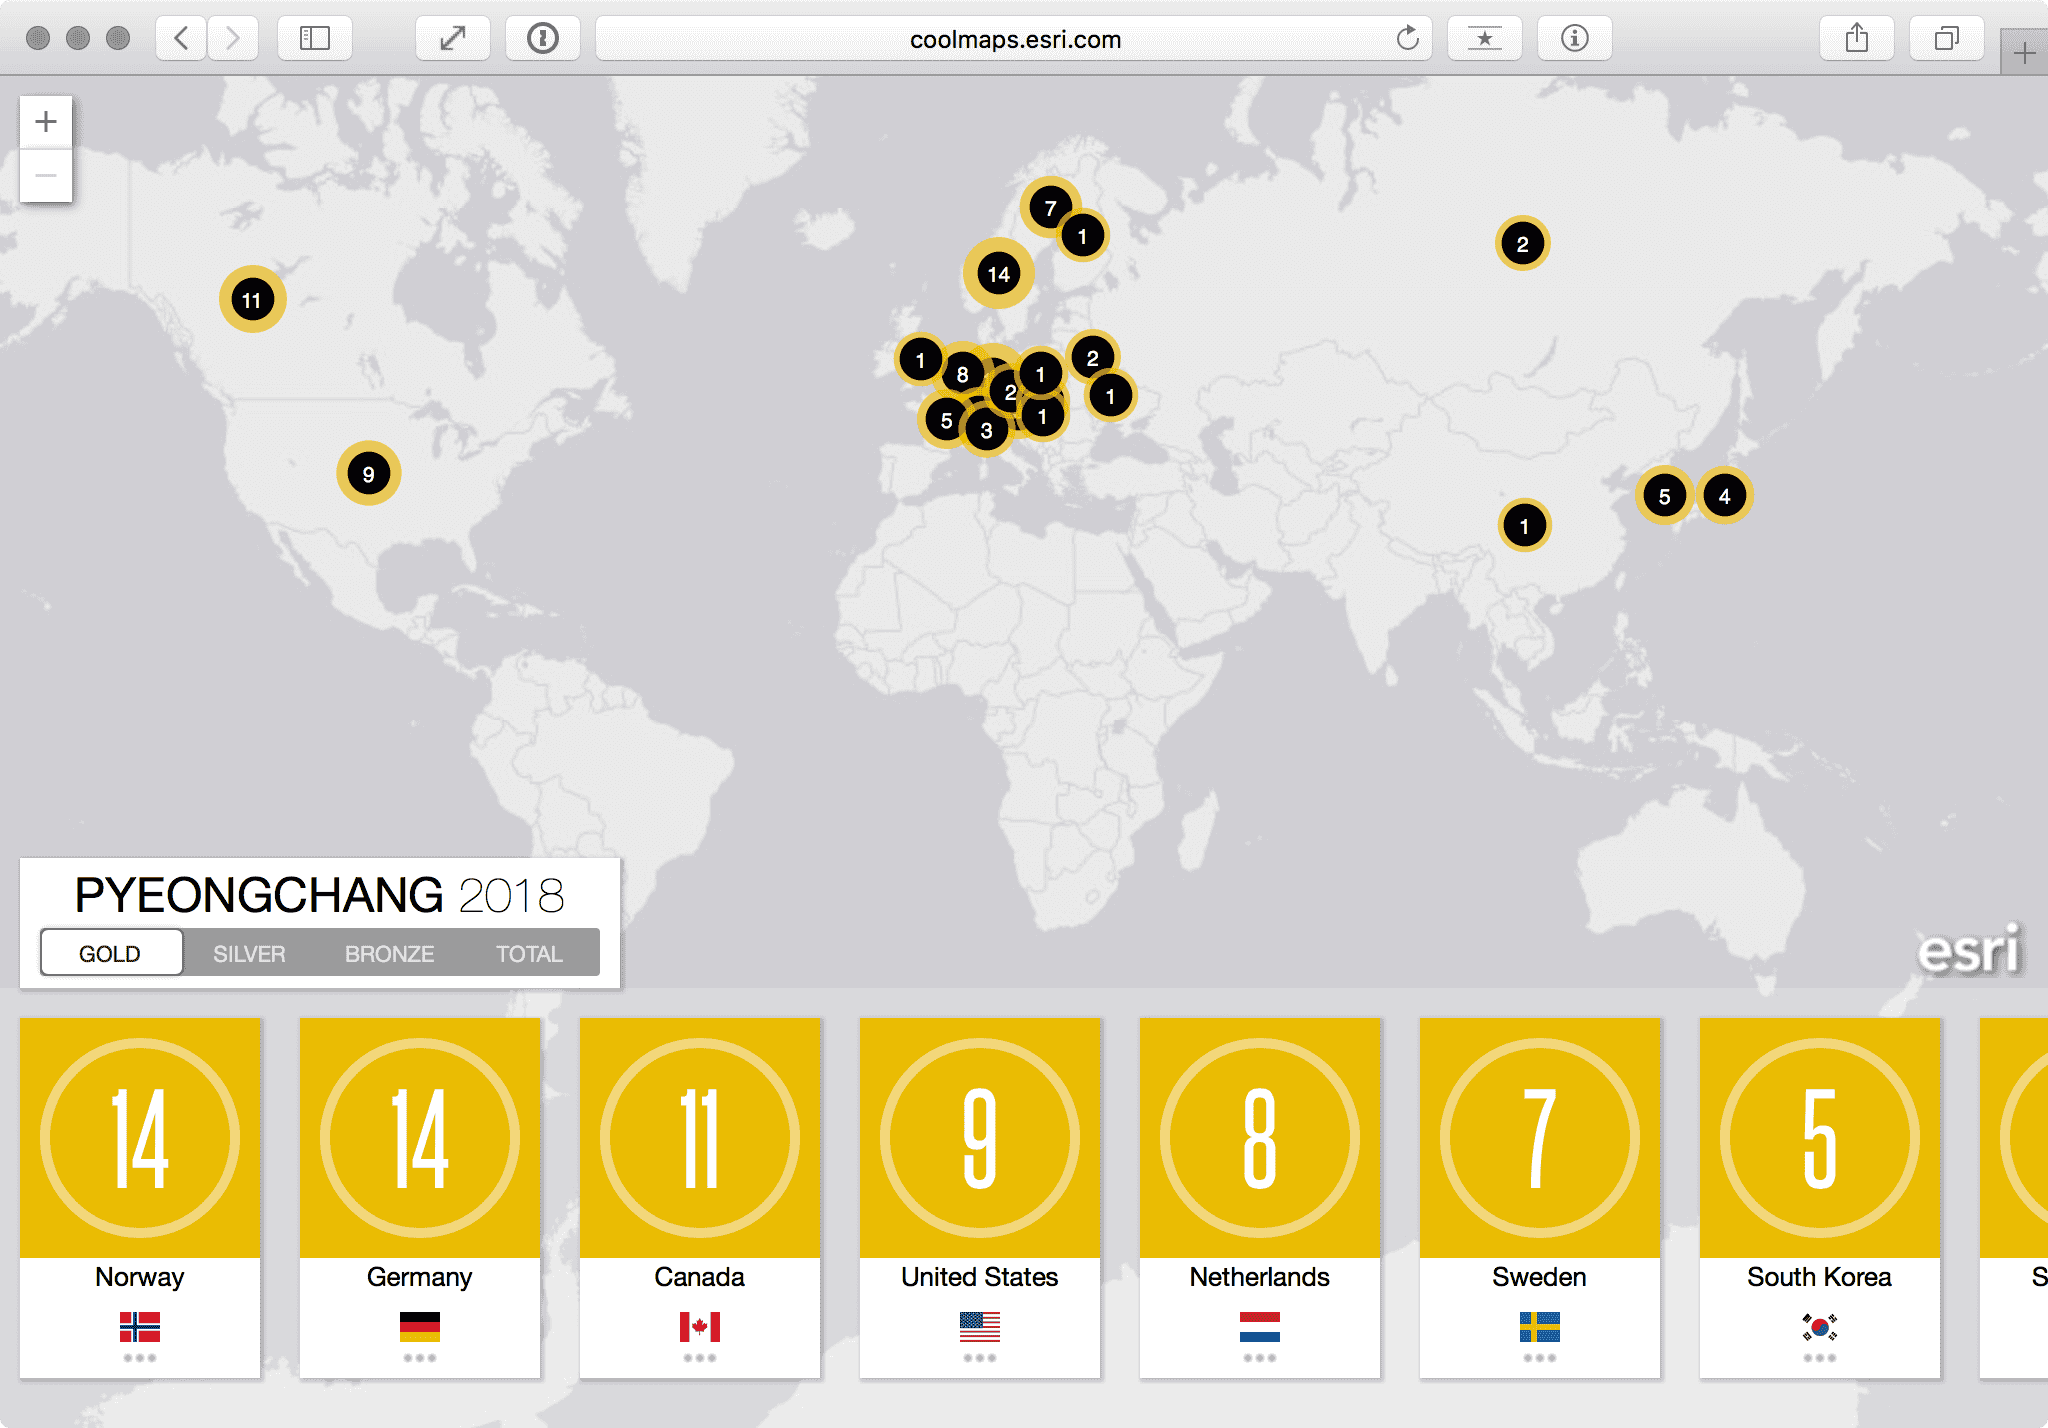
Olympic Medals Map
Mapping the Olympic medals at PyeongChang.
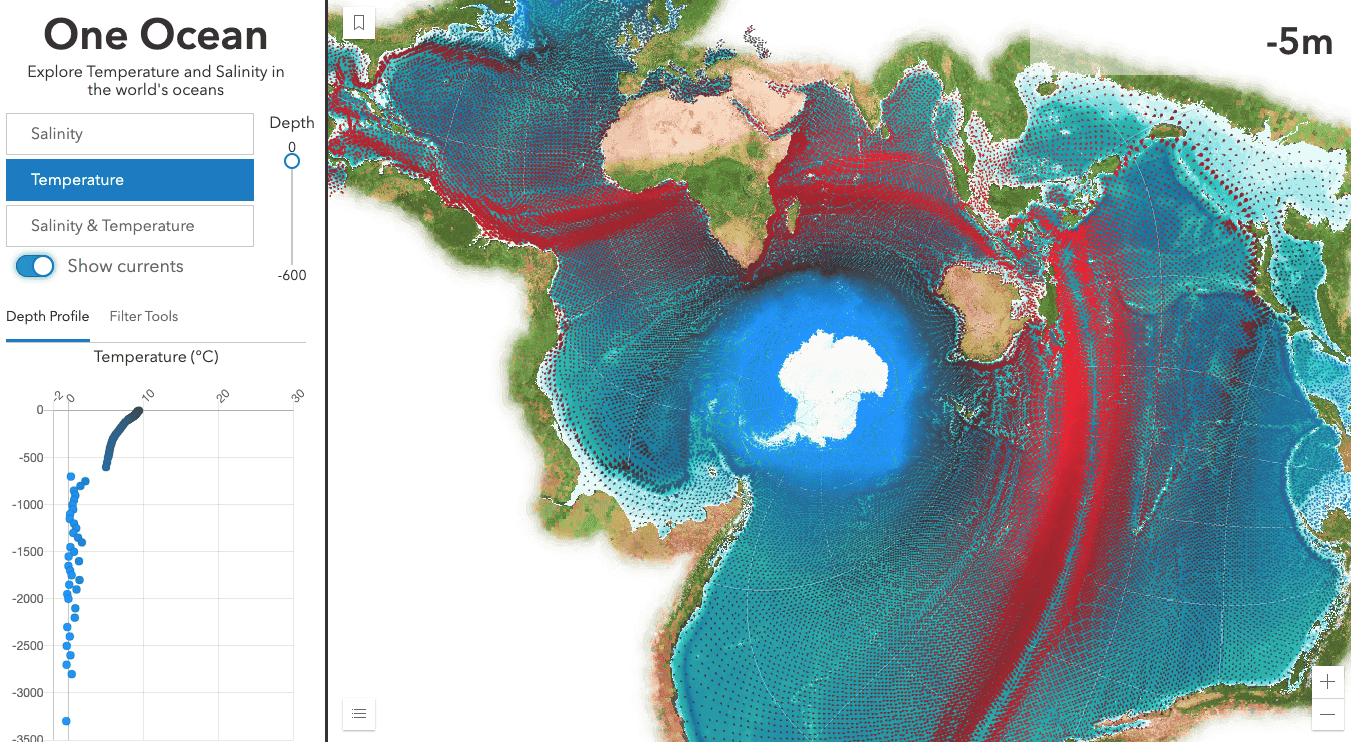
One Ocean
Explore temperature and salinity in the worlds oceans.
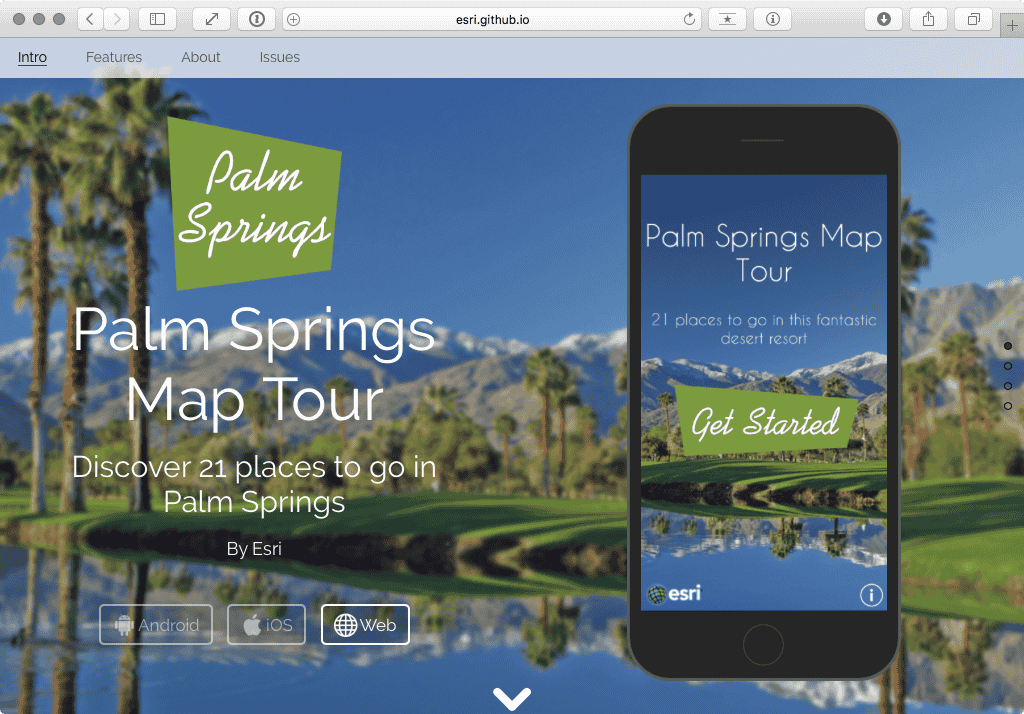
Palm Springs Map Tour
Rupert Essinger from the Esri Story Maps team shares 21 cool places to go in this fantastic desert resort.
Space Time Ripple
Visualize BigData through space and time.
