
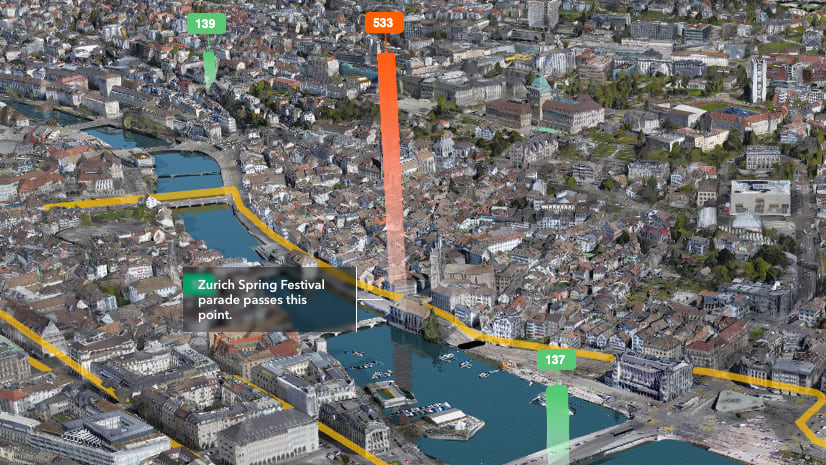
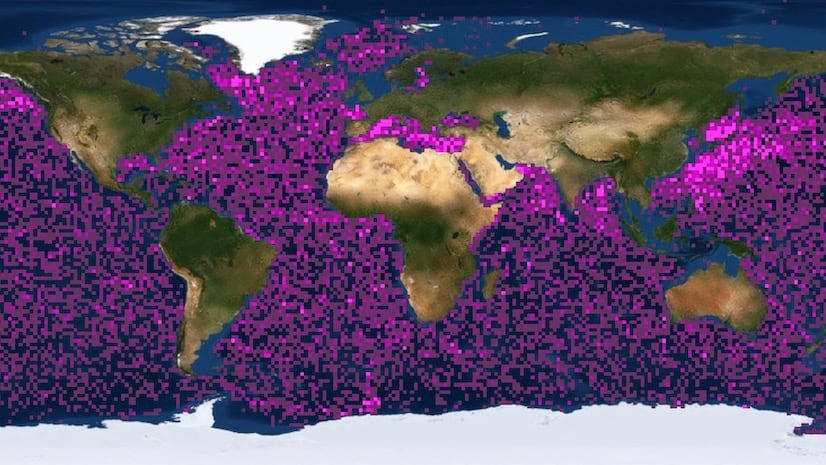
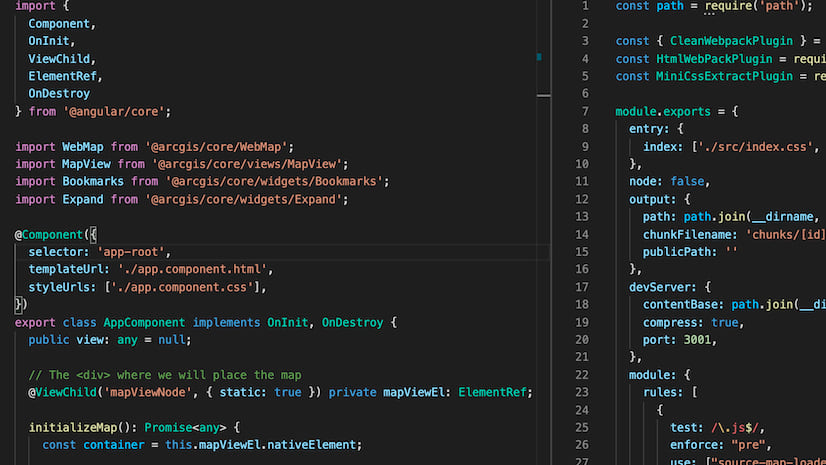
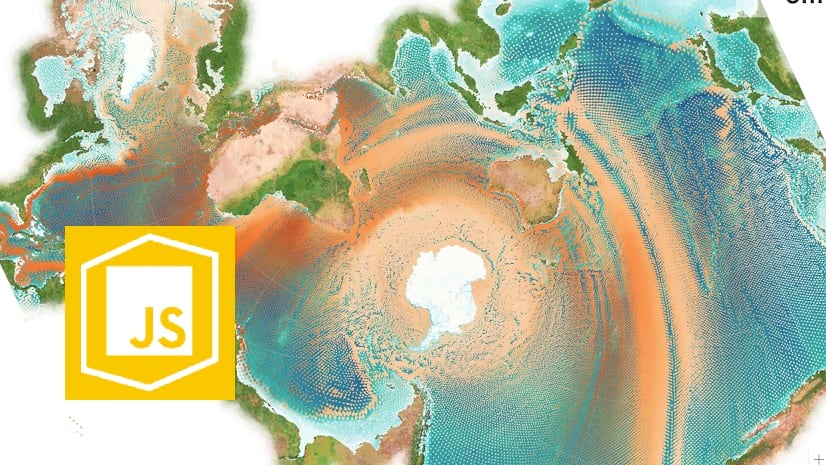
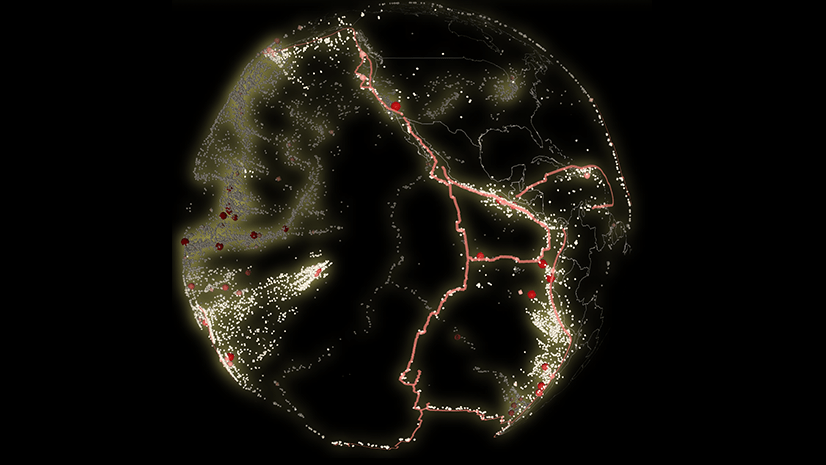
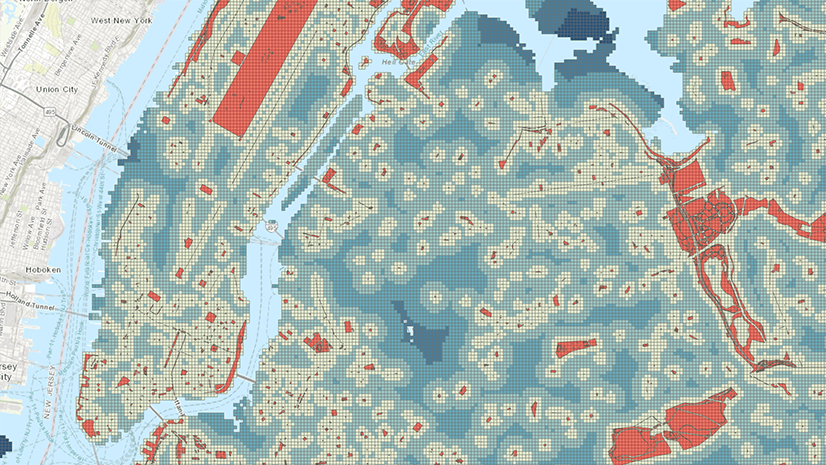
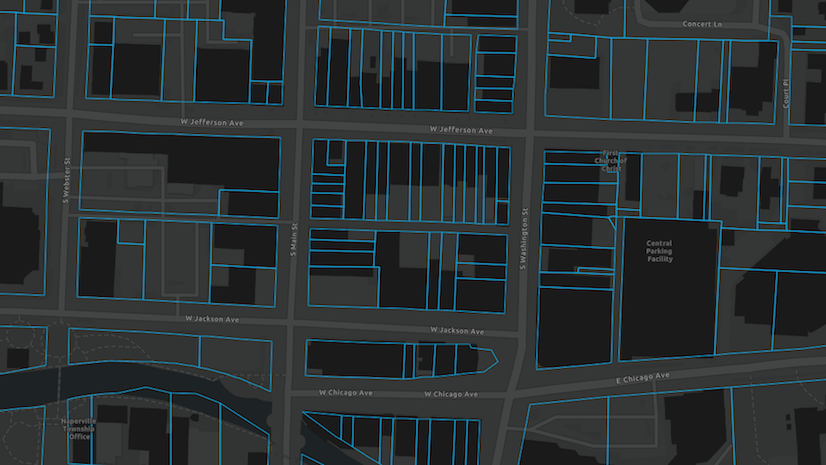
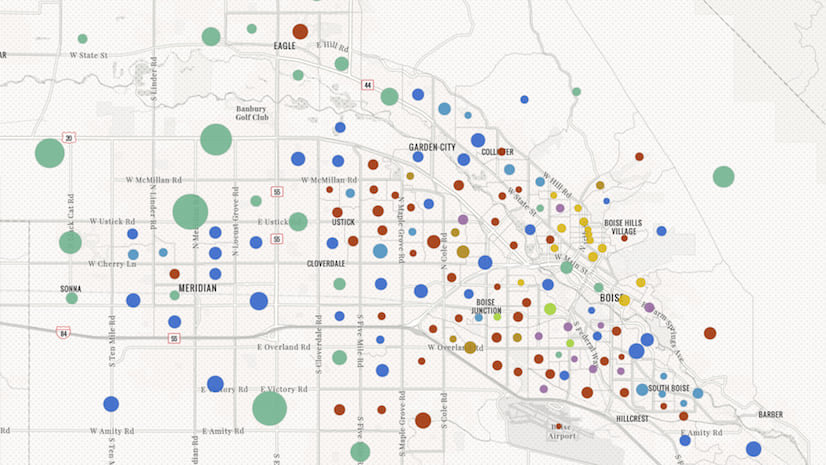
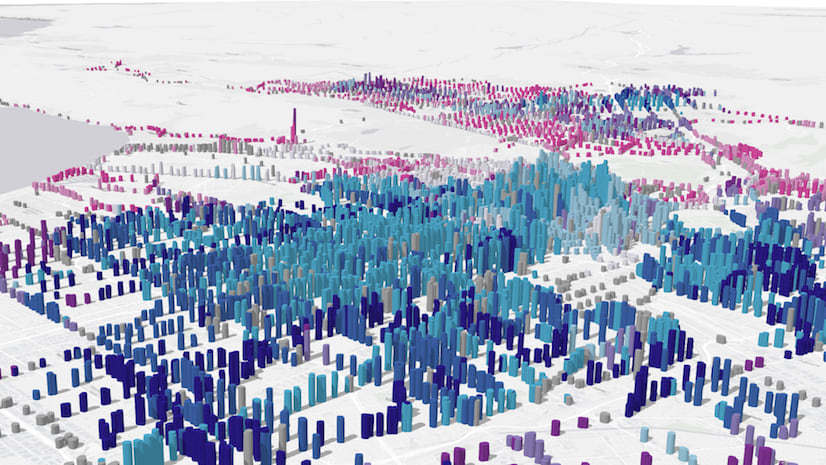
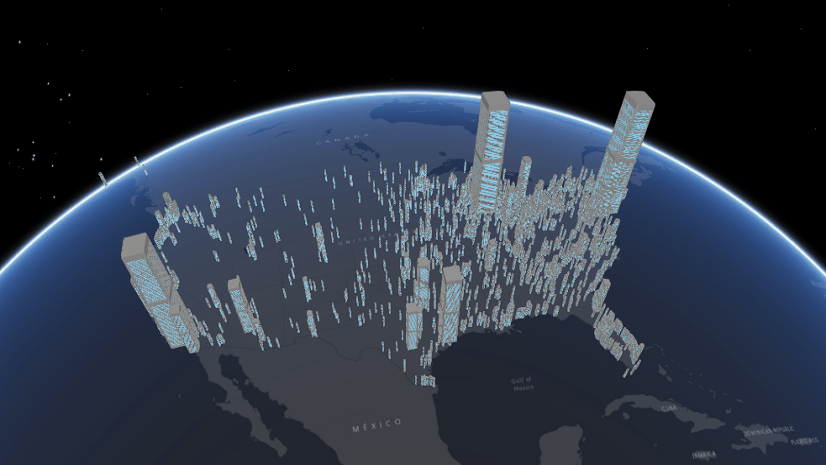
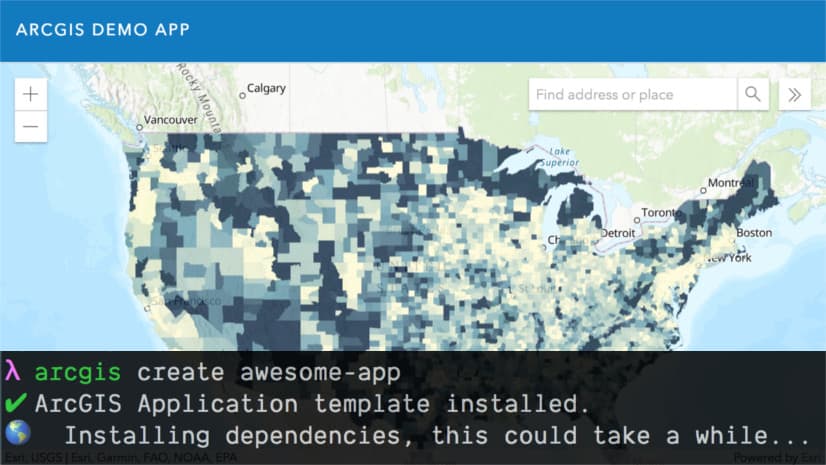
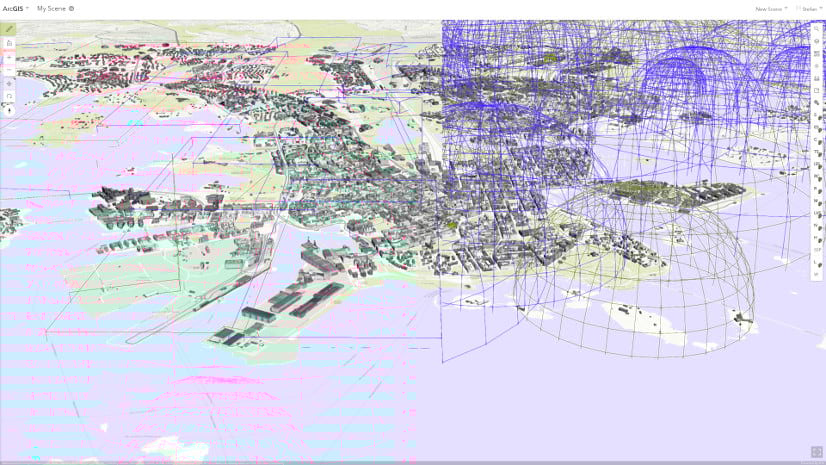
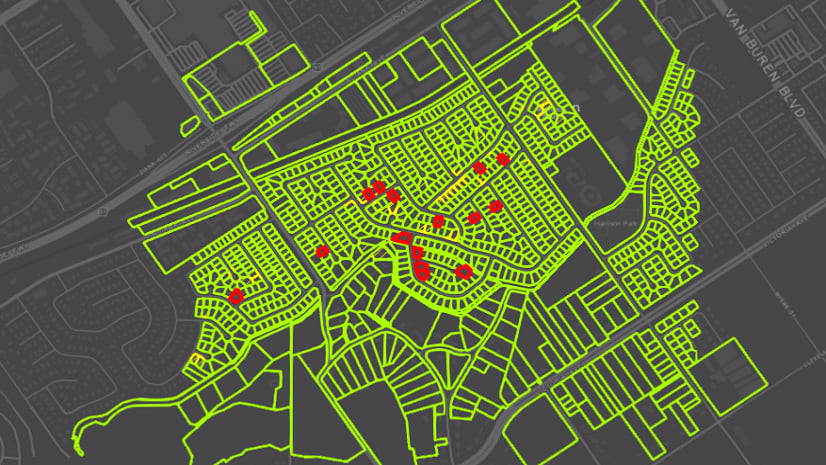
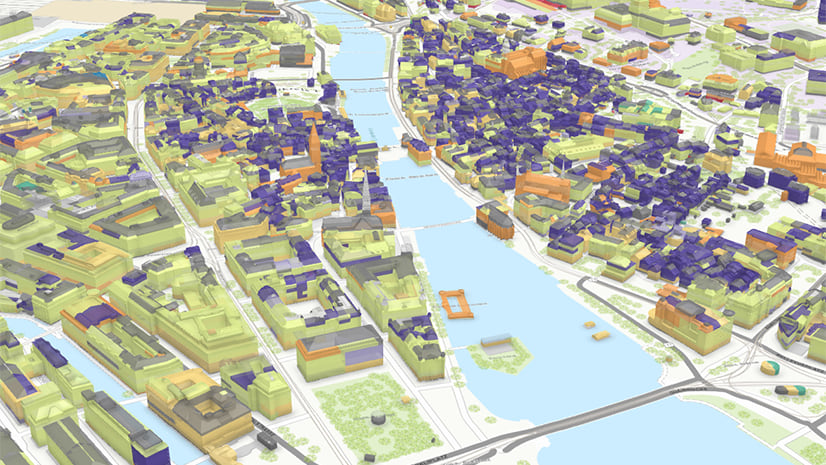
SaGIS: See more of your 3D Web Content
Stefan Eilemann | March 8, 2024
Introducing SaGIS: A Scalable GIS Renderer for the 3D ArcGIS Maps SDK for JavaScript.

Web Developer’s Guide to the 2024 Esri Developer Summit
Multiple Authors | March 4, 2024
How to make the most out of your week at 2024 Esri Developer Summit? This is a guide for web developers to navigate the event.
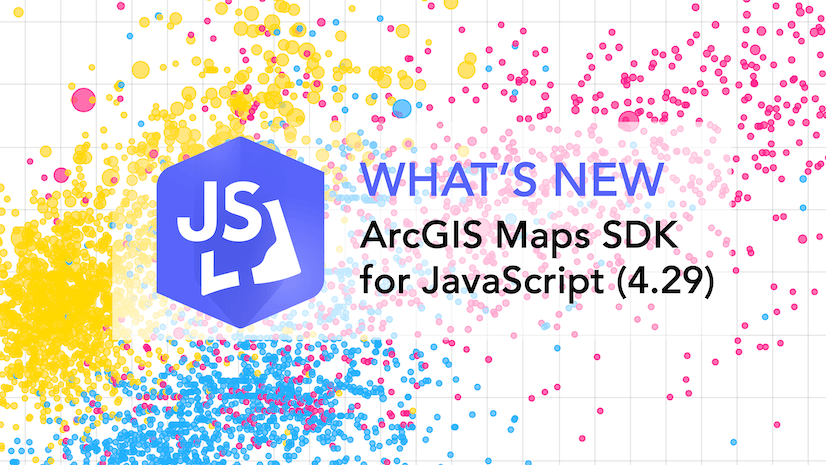
What’s New in ArcGIS Maps SDK for JavaScript (4.29)
Multiple Authors | February 26, 2024
The latest release of the JavaScript Maps SDK introduces charts components, editing constraints, 3D Tiles, better performance, and lots more.
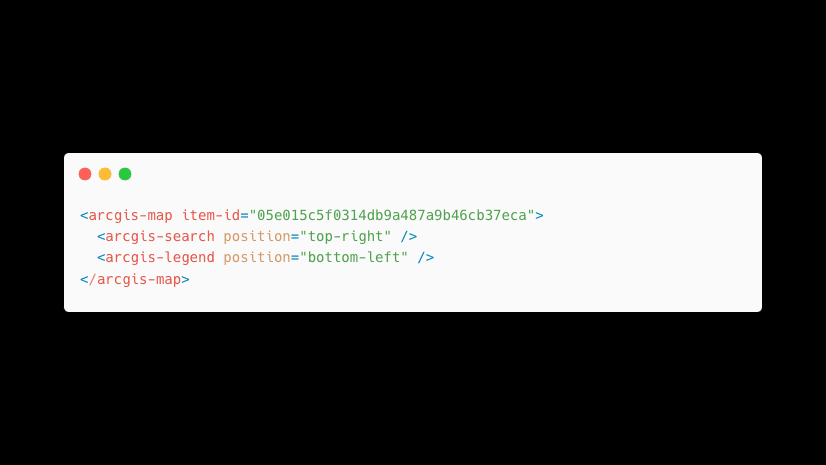
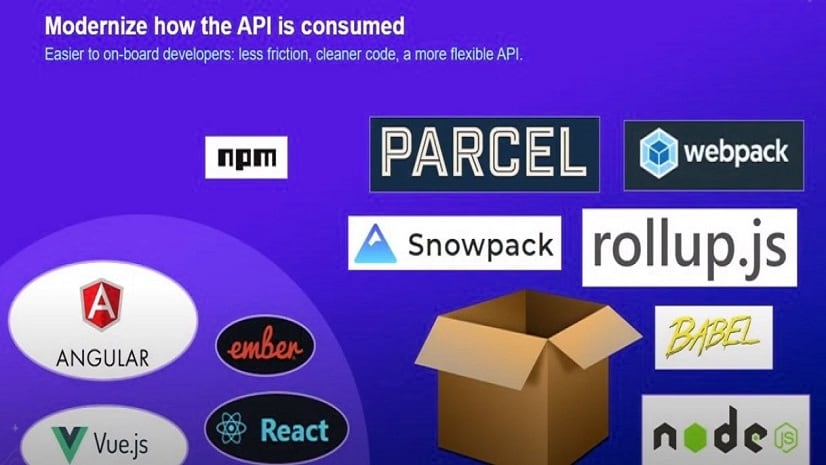
Build GIS Web Apps with JavaScript Maps SDK components
Omar Kawach | November 13, 2023
Build GIS web applications with ArcGIS Maps SDK for JavaScript components and Calcite Design System

Time Traveler’s Guide: Timestamp-offsets Exposed
Undral Batsukh | October 27, 2023
Learn more about how timestamp-offset fields can be used for visualization and analysis.
Watch the JavaScript Maps SDK v4.28 Livestream – available now!
Anne Fitz | October 23, 2023
Learn about the new features added at version 4.28 of the ArcGIS Maps SDK for JavaScript, directly from the product team!
What’s New in ArcGIS Maps SDK for JavaScript (4.28)
Multiple Authors | October 23, 2023
Version 4.28 is packed with new capabilities like Maps SDK Components, oriented imagery, improved date and time experience, and a lot more!
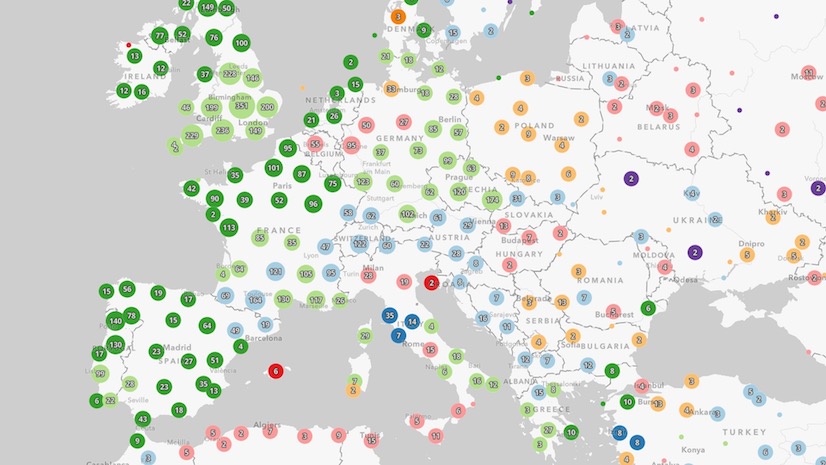
Visualizing Air Quality with Animated Symbols
Anne Fitz | August 7, 2023
Learn how to use animated CIM symbols within the ArcGIS Maps SDK for JavaScript to draw attention to features with poor air quality.
Watch the JavaScript Maps SDK v4.27 Livestream – available now!
Anne Fitz | June 28, 2023
Learn about the new features added at version 4.27 of the ArcGIS Maps SDK for JavaScript, directly from the product team!
A fresh new look for pop-ups
Lauren Boyd | June 20, 2023
Learn about the new pop-up design updates in the ArcGIS Online June 2023 and ArcGIS Maps SDK for JavaScript version 4.27 release.

Introducing new Arcade functions and an enhanced playground
Multiple Authors | June 16, 2023
The Arcade 1.23 release introduces three powerful new functions, an updated playground for testing your Arcade expressions, and more!

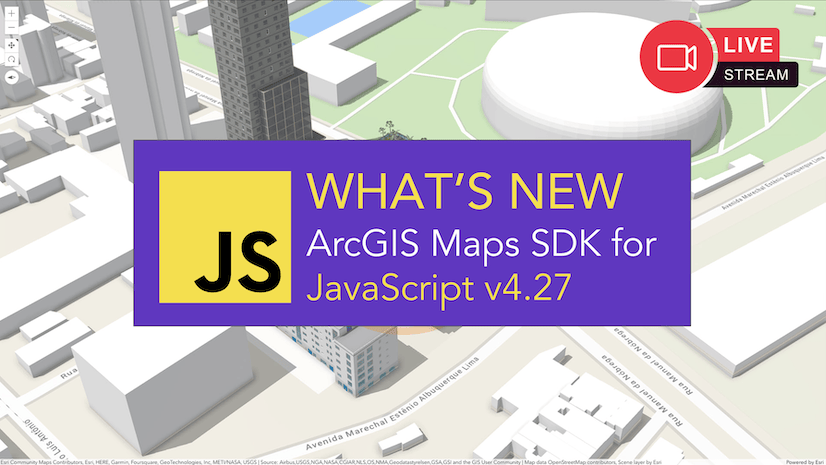
What’s New in ArcGIS Maps SDK for JavaScript (4.27)
Multiple Authors | June 12, 2023
Version 4.27 is packed with new capabilities including editing related records, editing scene layers & 3D basemaps, new widgets, and a lot more!

Five under-appreciated Arcade functions
Kristian Ekenes | June 6, 2023
These Arcade functions don't get enough love.
Visualize data from related records using Arcade
Kristian Ekenes | April 25, 2023
Learn why rendering data from related records is challenging and what you can do about it.
Build accessible web apps with ArcGIS Maps SDK for JavaScript and Calcite Design System
Multiple Authors | April 10, 2023
Learn how to make your web app accessible using the JavaScript Maps SDK and Calcite.
What’s new in the ArcGIS Maps SDK for JavaScript, v4.26 livestream – available now!
Anne Fitz | April 3, 2023
We talked about client-side raster functions, 3D enhancements, and more!

Real-Time Visualization & Analytics at the 2023 Esri EPC & DevSummit
Suzanne Foss | March 3, 2023
During the 2023 Esri DevSummit, explore the real-time visualization and analytics capabilities in the ArcGIS ecosystem.
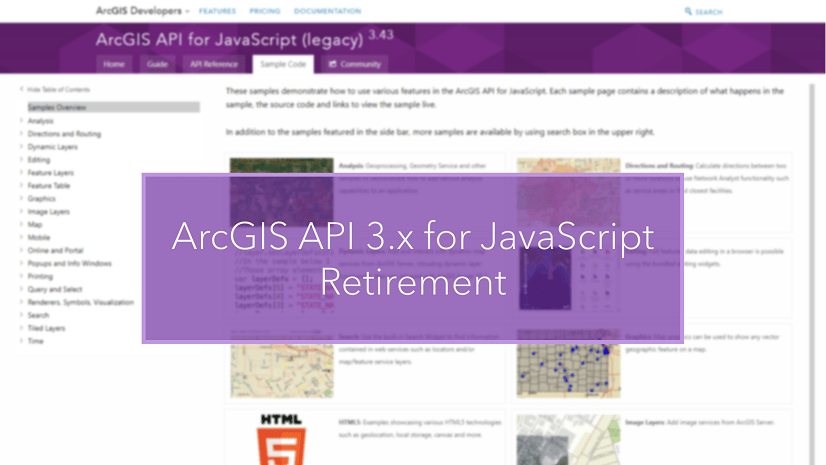
ArcGIS API for JavaScript, Version 3.x Retirement
Multiple Authors | February 27, 2023
ArcGIS API 3.x for JavaScript retires July 2024: Read about what this means and begin building apps with the ArcGIS Maps SDK for JavaScript.

Web Developer’s Guide to the 2023 Esri Developer Summit
Multiple Authors | February 24, 2023
Web developers have many great sessions to choose from this year at the 2023 DevSummit! This is a guide for planning your week.
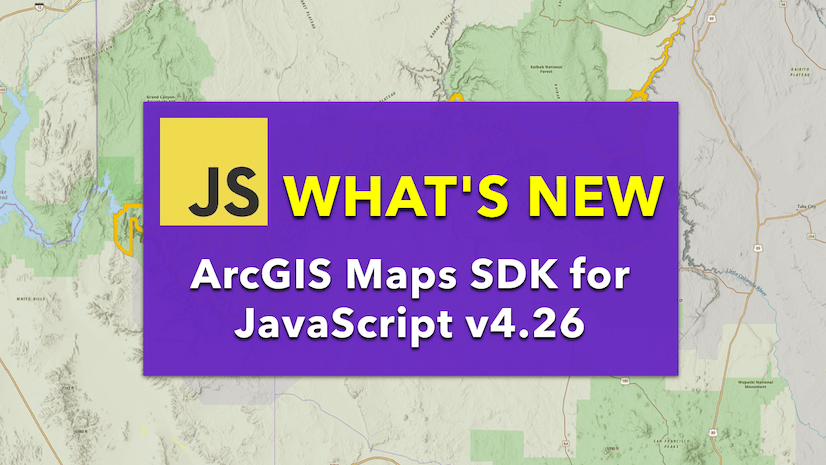
What’s new in ArcGIS Maps SDK for JavaScript (4.26)
Multiple Authors | February 22, 2023
Learn about the latest advances in the JavaScript Maps SDK such as highlight enhancements, interactive placement of media overlays, and more.
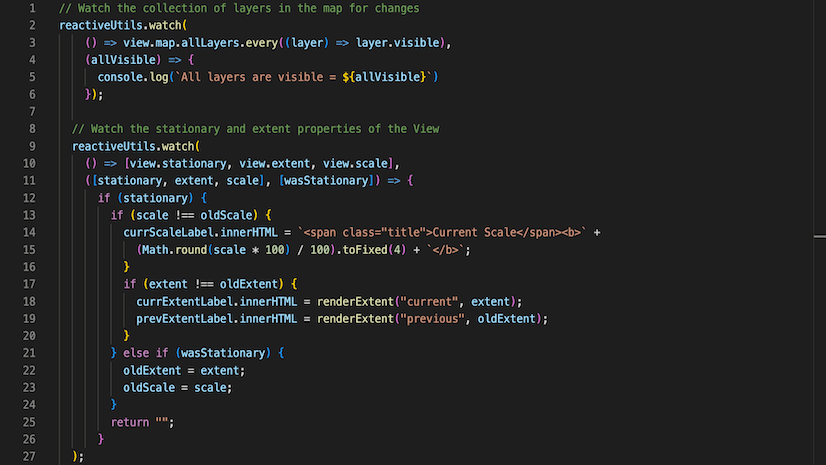
Why you should be using reactiveUtils instead of watchUtils
Multiple Authors | February 22, 2023
Information on the benefits of using reactiveUtils over watchUtils with the ArcGIS Maps SDK for JavaScript.

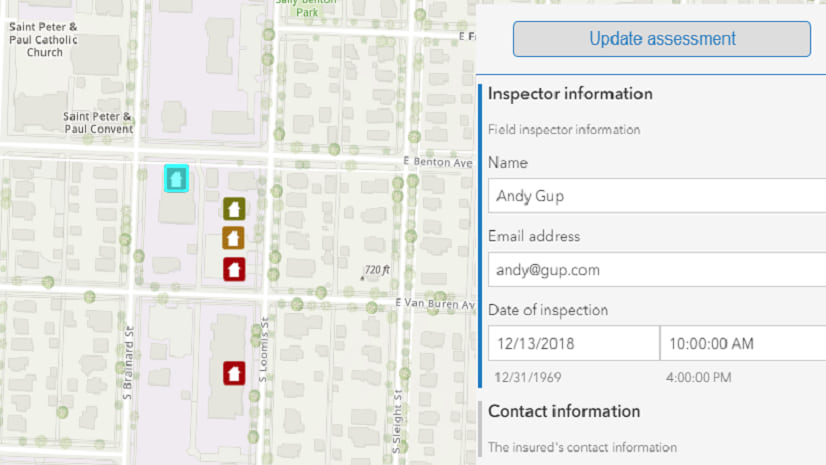
Using the ArcGIS Maps SDK for JavaScript in Virtualized Environments
Andy Gup | February 21, 2023
Virtualized environments need to be tuned to maximize the performance of web mapping applications.
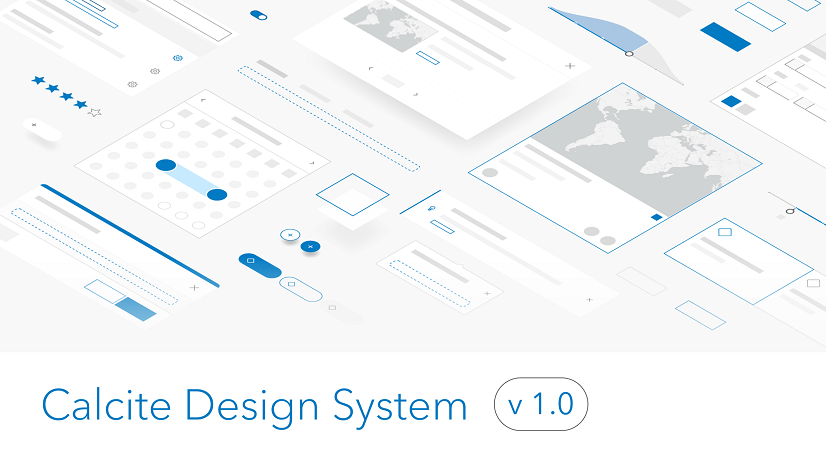
Calcite Design System 1.0 released!
Multiple Authors | January 25, 2023
The production release of Calcite Design System is available! Learn about 1.0 and how you can use Calcite to build user-friendly web apps.
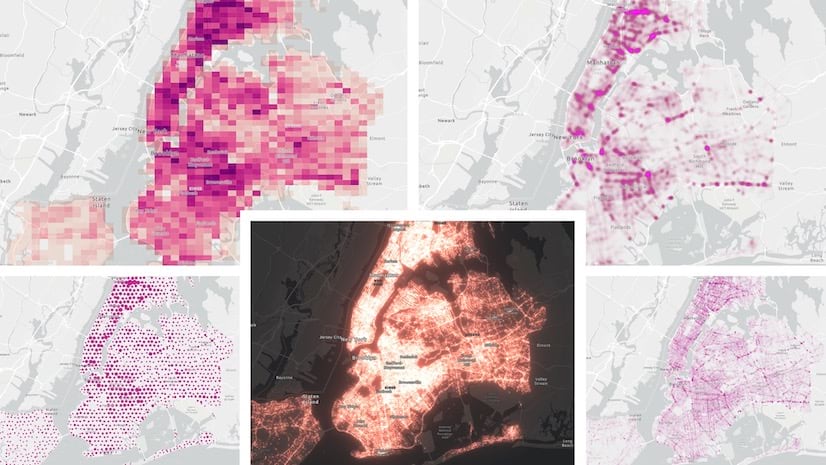
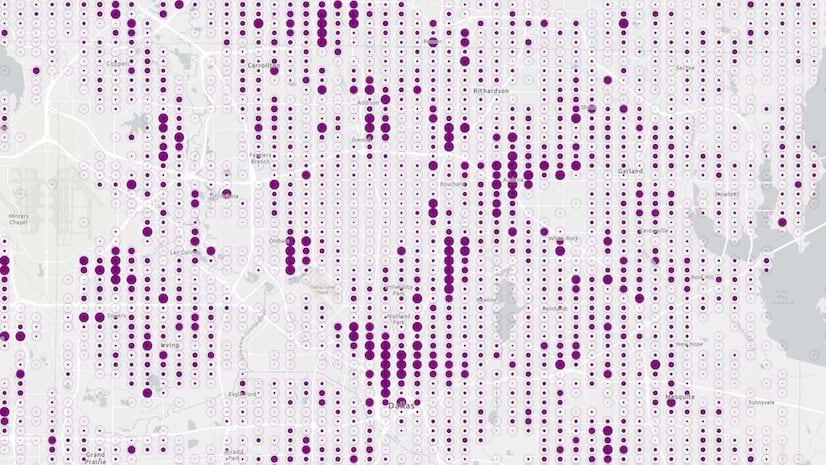
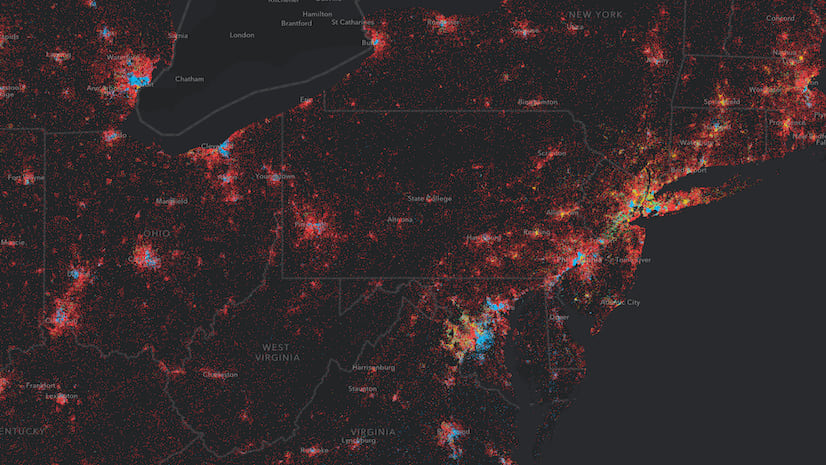
Five ways to visualize point density using the same dataset
Kristian Ekenes | January 3, 2023
Explore five different ways to visualize point density on the web using the same dataset.
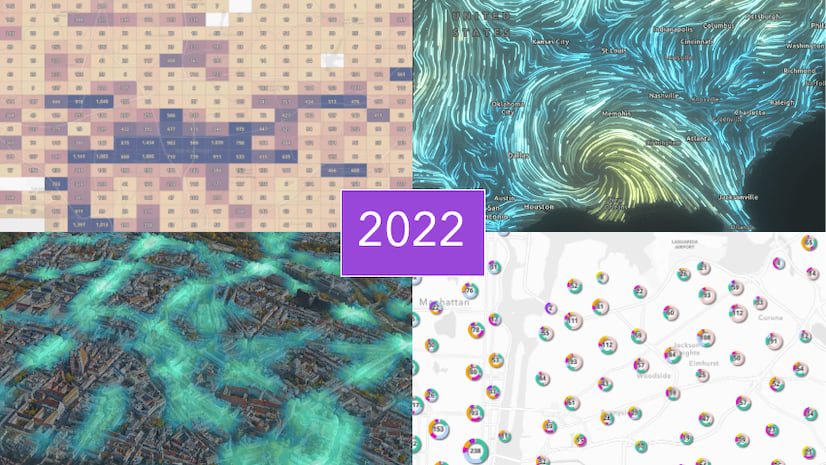
2022 Year in Review: ArcGIS Maps SDK for JavaScript
Anne Fitz | December 16, 2022
Take a look back on all the new features added to the ArcGIS Maps SDK for JavaScript in 2022.
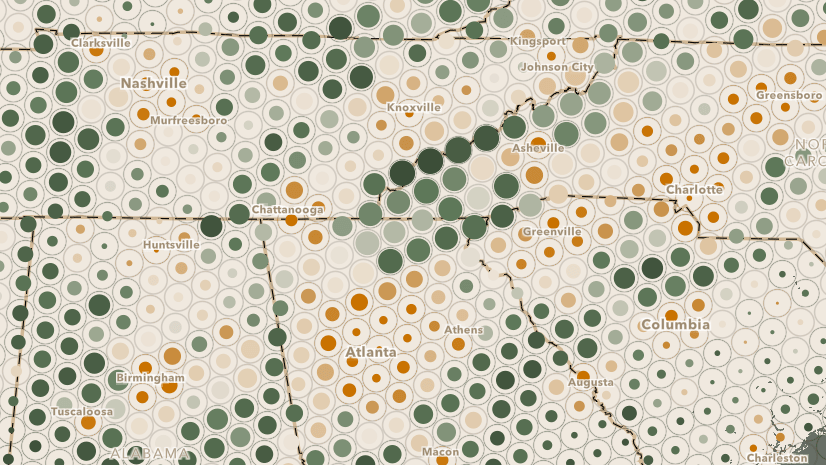
Density mapping with binning and Wurman dots
Kristian Ekenes | December 13, 2022
Thanks to binning, creating a Wurman dot density visualization is more accessible than ever before.
Browsing Related Records with the ArcGIS API for JavaScript
Lauren Boyd | December 6, 2022
Learn how to configure browsing related records within pop-ups in your ArcGIS API for JavaScript applications.
How to summarize aggregate data using Arcade in popups
Kristian Ekenes | December 5, 2022
Arcade can help you create dynamic, interactive popup content summarizing aggregate data in binning visualizations.
8 ways to style point clusters on the web
Kristian Ekenes | November 29, 2022
Learn the various ways you can customize the style of point clusters in web apps.

Join us for a live discussion: What’s new in the ArcGIS API for JavaScript, v4.25
Multiple Authors | November 17, 2022
Join us on Tuesday, November 29th at 9am PST for a livestream discussion on what's new in version 4.25 of the JS API!
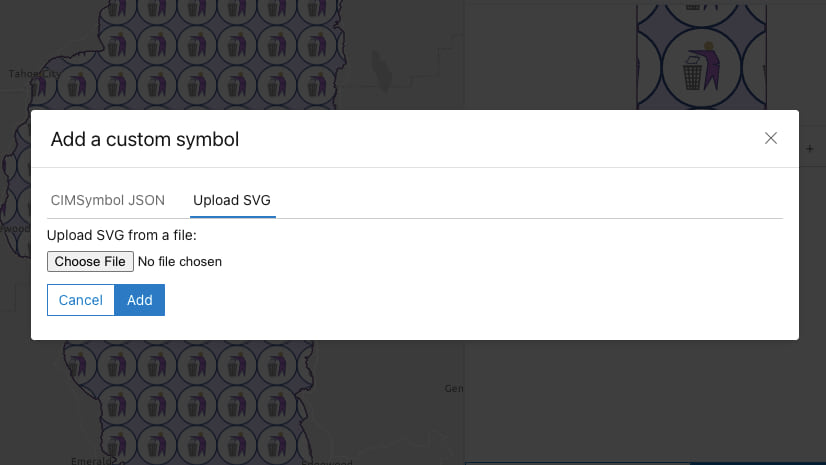
Upload symbols from SVG in the updated CIM Symbol Builder
Anne Fitz | November 17, 2022
In the latest update of the CIMSymbol Builder, you can upload symbols from an SVG file, allowing you to easily create custom multi-layer symbols.

Introducing the ArcGIS Maps SDKs
Multiple Authors | November 16, 2022
Starting in December, we will begin delivering our client SDKs and APIs under one name as the ArcGIS Maps SDKs.

Introducing new Arcade documentation
Kristian Ekenes | November 10, 2022
Learn about the new Arcade documentation pages and why making these changes was necessary for improving the experience of learning Arcade.
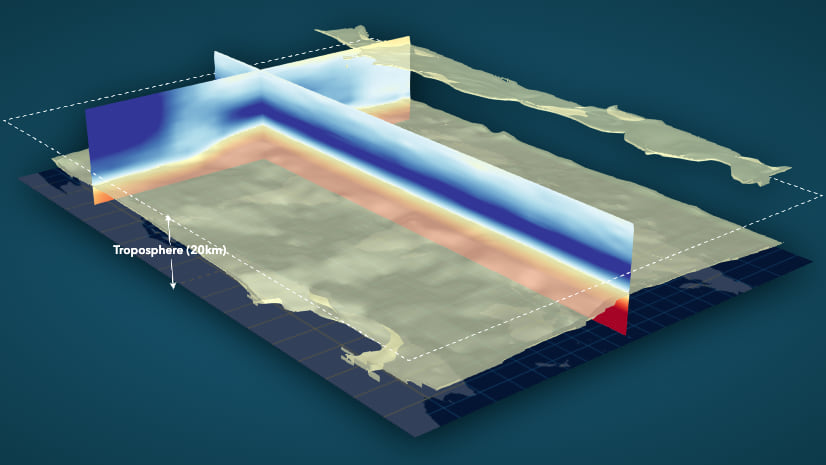
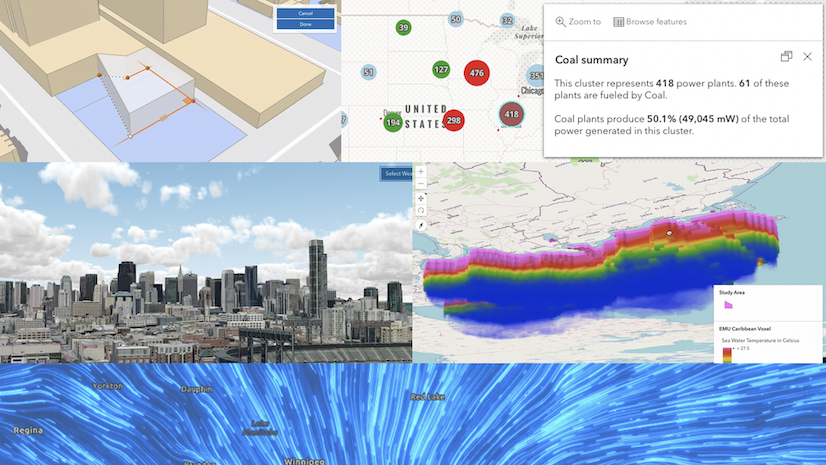
Voxel layers – exploring world atmospheric temperature and pressure with ArcGIS API for JavaScript
Raluca Nicola | November 10, 2022
Using ArcGIS API for JavaScript to explore multidimensional datasets in a web application
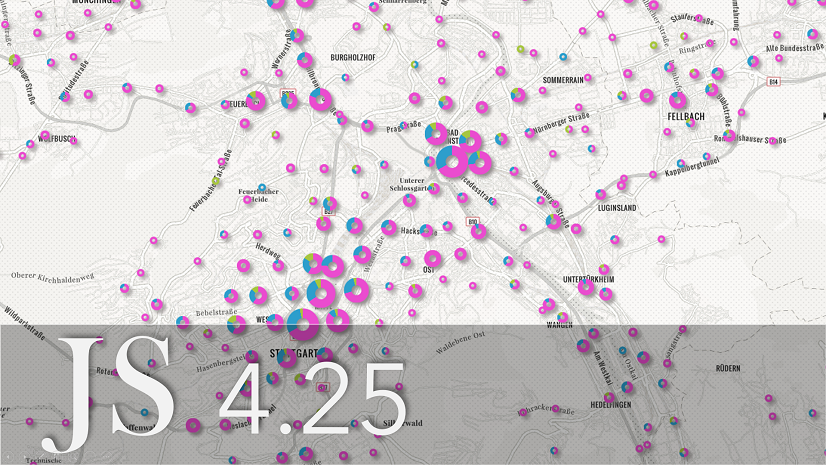
What’s new in ArcGIS API for JavaScript (v4.25)
Multiple Authors | November 9, 2022
The JavaScript API was updated with related records in popups, the ability to customize cluster symbols, dimensioning in 3D, and much more.
Spatial analysis for developers
Multiple Authors | October 28, 2022
Build different types of spatial analysis applications with ArcGIS client-side APIs and the spatial analysis service.

Wildfire Aware App Design and Implementation
Multiple Authors | October 26, 2022
The Esri team responsible for the Wildfire Aware app shares key design and implementation decisions.
Cartographic styles for visualizing 3D bars in web scenes
Raluca Nicola | October 20, 2022
Custom cartographic styles for visualizing 3D bars in web scenes
Experimenting with 3D labels in ArcGIS API for JavaScript
Raluca Nicola | October 5, 2022
How to create custom 3D labels for web maps using ArcGIS API for JavaScript
Notification that old Esri Vector Basemaps (version 1) will be retired December 1, 2022
Sarah Osborne | September 13, 2022
Esri’s vector basemaps "version 1" will be retired December 1, 2022.
How to create a custom Arcade profile
Kristian Ekenes | September 7, 2022
Learn how to create a custom Arcade profile and execute expressions in the context of a web app.
Execute Arcade expressions on your terms
Kristian Ekenes | August 22, 2022
Have you ever wanted to run an Arcade script outside of a traditional Arcade profile? Now you can.
I’m a developer. Do I really need Arcade?
Kristian Ekenes | August 16, 2022
Developers can already customize ArcGIS apps with almost any language. Learn why Arcade matters, and what you can do to leverage it in your apps.

Exploring Earth’s artificial satellites
Raluca Nicola | August 1, 2022
Learn about Earth's artificial satellites, what are they used for, who owns them and how high up they orbit the Earth.
Binning now available in the ArcGIS API for JavaScript
Kristian Ekenes | July 6, 2022
Version 4.24 of the ArcGIS API for JavaScript introduced client-side binning as a new feature reduction method for aggregating points.

Using Svelte with the ArcGIS API for JavaScript
Gavin Rehkemper | July 5, 2022
Learn about the Svelte JavaScript framework and how to integrate it into the ArcGIS API for JavaScript

Changing Directions
Multiple Authors | June 28, 2022
The Directions widget is now integrated with the RouteLayer.
How to create heat maps that work at all scales
Kristian Ekenes | June 27, 2022
Heat maps are notoriously sensitive to scale. Learn four things you should consider when creating heat maps so they work across all scale levels.
Heat maps now render faster and smoother in the browser
Kristian Ekenes | June 23, 2022
Heat maps in the ArcGIS API for JavaScript are now faster, smoother, and can render more data in the browser than ever before.
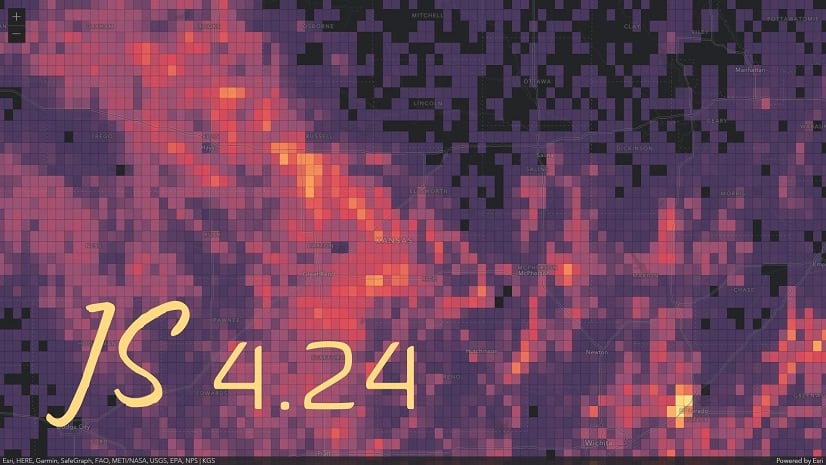
What’s new in ArcGIS API for JavaScript (version 4.24)
Julie Powell | June 23, 2022
Image and video overlays, pie chart layer style, faster heatmaps, client-side binning, rain and snow effects in scenes, and lots more.

Live discussion: What’s New in the ArcGIS API for JavaScript v4.24
Multiple Authors | June 22, 2022
Join us on Tuesday, June 28th for a livestream of new features in version 4.24 of the ArcGIS API for JavaScript.
ArcGIS API for JavaScript – Learn about ES modules
Andy Gup | June 21, 2022
If you heard about ES modules and want to learn more, then check out this blog and tutorial!
Getting the most out of editing in Map Viewer and ArcGIS API for JavaScript
Multiple Authors | May 5, 2022
Web editing provides tools which can help facilitate an interactive editing experience adapted to fit your data model.

Visualizing Uncertainty in 3D for Urban Planning
Lisa Staehli | May 4, 2022
A call for best practices on visualizing uncertainty in 3D for urban planning.
Create a diversity map with Arcade
Kristian Ekenes | April 21, 2022
Learn how to map diversity by creating an index using ArcGIS Arcade.

One Minute Map Hacks: 61-65
John Nelson | April 21, 2022
Has it come to this?
Contingent Attribute Values in the ArcGIS API for JavaScript
Jose Banuelos | April 18, 2022
Learn how to create contingent values in ArcGIS Pro, publish a service with them, and consume them in the ArcGIS API for JavaScript.

Building ArcGIS API for JavaScript Apps with NextJS
Rene Rubalcava | April 14, 2022
You can use the ArcGIS API for JavaScript, with React and NextJS to build scalable and performant applications.
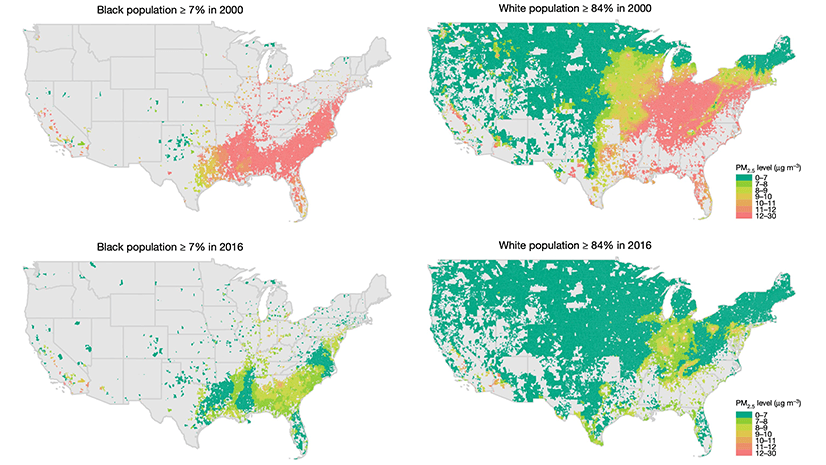
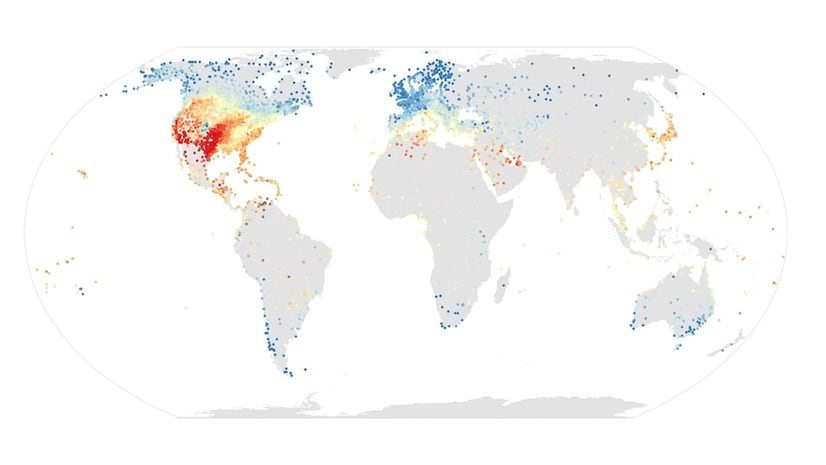
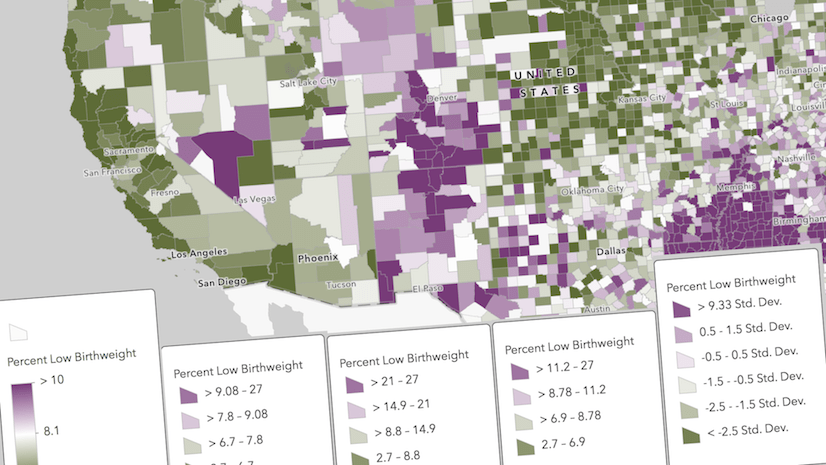
Air Quality Disparities Are Growing Among Ethnic Groups and Income Levels
Victoria Phillips | April 13, 2022
A new study from Harvard and Esri researchers has determined air quality disparities among ethnic groups and income in the US.

Rest is up to the task
Multiple Authors | April 7, 2022
Tasks have been deprecated since 4.20. They will be removed at 4.24.

Join us for a live discussion: What’s New in the ArcGIS API for JavaScript, version 4.23
Anne Fitz | April 7, 2022
Join us on Wednesday, April 13th for a live discussion of new features in version 4.23 of the ArcGIS API for JavaScript.
Jumpstart your visualization: build on top of an existing custom 2D layer
Dario D'Amico | March 31, 2022
Learn how to take an existing custom 2D layer and use it as a starting point for your own unique visualization.
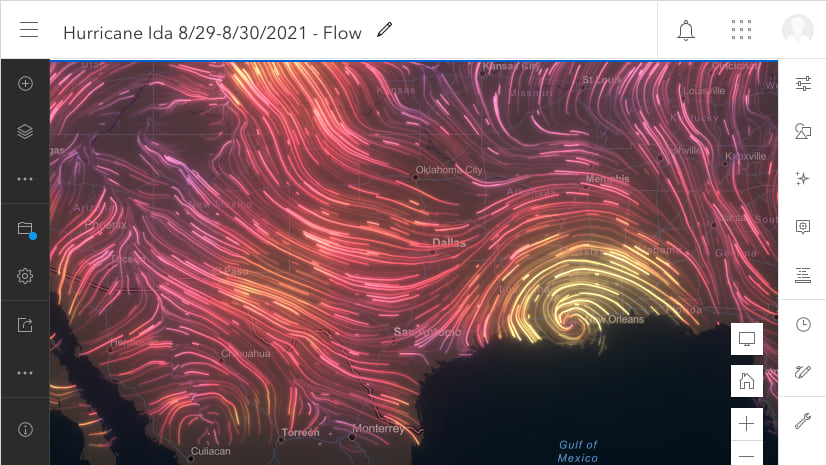
Preparing your data for use with the FlowRenderer
Anne Fitz | March 29, 2022
The FlowRenderer uses raster layers with magnitude and direction to visualize flow. Learn how to prepare your data for flow visualization.

Introducing the new RouteLayer
Noah Sager | March 24, 2022
RouteLayer is a new layer at version 4.23 of the ArcGIS API for JavaScript that provides routing analytics and route visualization.
What’s new in ArcGIS API for JavaScript (4.23)
Julie Powell | March 23, 2022
Version 4.23 offers the ability to go between basemaps with different spatial references, 3D heatmaps, a new editing experience and a lot more.

Create an animated flow visualization with the ArcGIS API for JavaScript
Anne Fitz | March 23, 2022
Learn all about the new FlowRenderer and how to use it in the ArcGIS API for JavaScript.

How to add an inner glow to polygons with the ArcGIS API for JavaScript
Multiple Authors | March 3, 2022
Pictures strokes are here to save the day
Zoom. Enhance.
Multiple Authors | February 3, 2022
The ArcGIS API for JavaScript lets you do all manner of app/viz shenanigans.
Notification that old Esri Vector Basemaps will be retired in 2022
Sarah Osborne | January 19, 2022
Esri’s vector basemap "beta 2" and "version 1" will be retired in 2022.

Visualize raster using a vector field in ArcGIS
Multiple Authors | January 12, 2022
Visualize ocean and atmospheric data using vector field and animated flow renderers in ArcGIS and create maps for desktop and web applications
Summarize and explore point clusters with Arcade in popups
Kristian Ekenes | January 10, 2022
Learn how to use Arcade to display more detailed information in cluster popups with charts, tables, and custom HTML elements.
A year in review: ArcGIS API for JavaScript, 2021
Anne Fitz | December 31, 2021
Take a look back at all the highlights from the ArcGIS API for JavaScript in 2021.
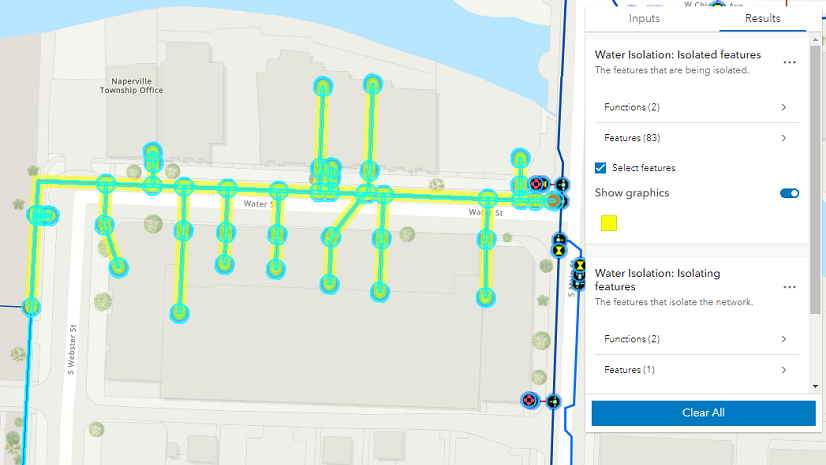
Trace a Utility Network with the ArcGIS API for JavaScript
Alix Vézina | December 13, 2021
Trace how resources flow through a utility network with ArcGIS API for JavaScript.
Techniques for visualizing high density data on the web
Kristian Ekenes | December 9, 2021
The ArcGIS API for JavaScript added documentation that helps guide you in making decisions for visualizing large, dense datasets.

What’s new in the ArcGIS API for JavaScript (version 4.22)
Julie Powell | December 9, 2021
This is a packed release! Realistic weather for 3D scenes, animated streamlines, better cartography, key updates to GeoJSON layers, and more.

Technology Enhancements in ArcGIS for Power BI Latest Release
Andrew Lau | November 24, 2021
Learn about technology enhancements in ArcGIS for Power BI latest release.

ArcGIS Online Map Viewer supports date-time data off multiple time zones in a single layer
Multiple Authors | November 10, 2021
ArcGIS Online map viewer and ArcGIS API for JavaScript 4.21 support unknown time zone allowing to serve data from multiple time zones in a layer.
How and why to configure feature display order in web apps
Kristian Ekenes | October 11, 2021
Learn how to sort features by data value in web apps to establish a clear visual hierarchy and bring focus to your maps.

What’s new in Utility Network JavaScript API 4.21
Hussein Nasser | September 30, 2021
This blog demonstrates what is new in the Utility Network JavaScript API 4.21
What’s new in the ArcGIS API for JavaScript (version 4.21)
Julie Powell | September 22, 2021
This API update includes performance improvements, control over feature drawing order, better snapping, WGS84 support in local scenes, and more.
Performance improvements in version 4.21 of the ArcGIS API for JavaScript
Anne Fitz | September 22, 2021
Version 4.21 of the ArcGIS API for JavaScript contains performance improvements that will improve the draw time of polygon layers.
CIM Symbol Builder
Multiple Authors | September 22, 2021
Use the CIM Symbol Builder to design CIM symbols with a simple user interface and then copy the JSON into your custom web application.
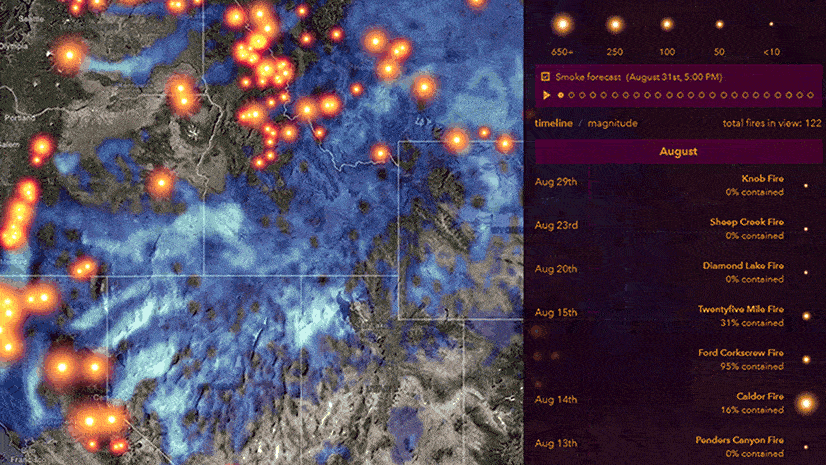
Improvements to the USA Wildfires map’s Smoke Forecast
Multiple Authors | September 1, 2021
Improvement to the smoke forecast layer's design make it easier to visualize.

Visualize and animate flow in MapView with a custom WebGL layer
Dario D'Amico | August 31, 2021
Learn how to animate streamlines using WebGL and a custom layer.
Animating your data with the ArcGIS API for JavaScript
Anne Fitz | August 31, 2021
Create multi-dimensional animations of your data to visualize patterns as the geometry or attributes change.

Calling All Developers at User Conference 2021!
Amy Niessen | July 11, 2021
If you're a developer, or just wanting to check out what is available for developers, at UC check out the ArcGIS Platform for Developers track!
How to use the SubtypeGroupLayer with the ArcGIS API for JavaScript
Jose Banuelos | July 9, 2021
Learn how to bring in a subtype group layer from ArcGIS Pro into your ArcGIS API for JavaScript web applications.

Feature selection styles in web scenes: the defaults and beyond
Multiple Authors | July 8, 2021
In this blog post we look into three different styles for feature selection in a webscene.

Utility Network is now on ArcGIS JavaScript API 4.20
Hussein Nasser | July 1, 2021
Utility Network JavaScript API is now available on the Esri ArcGIS JavaScript 4.20 release
What’s New in ArcGIS API for JavaScript (version 4.20)
Julie Powell | June 30, 2021
Version 4.20 brings WFS 2.0 support, shadow analysis, analysis layers, initial support for utility networks, and more.
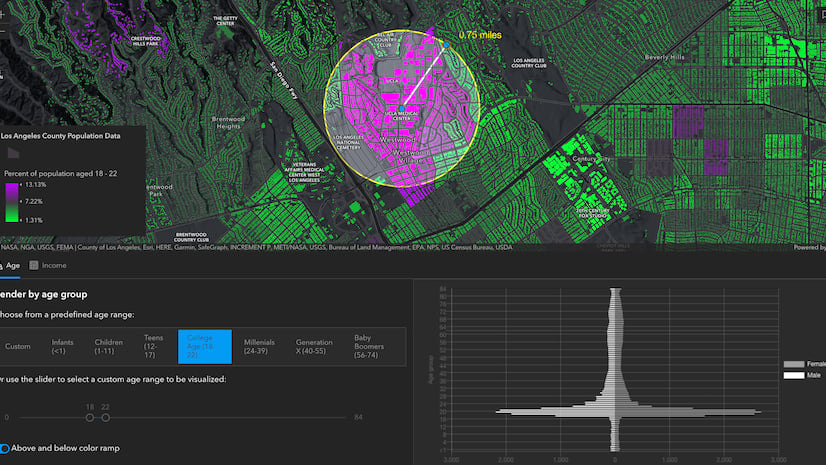
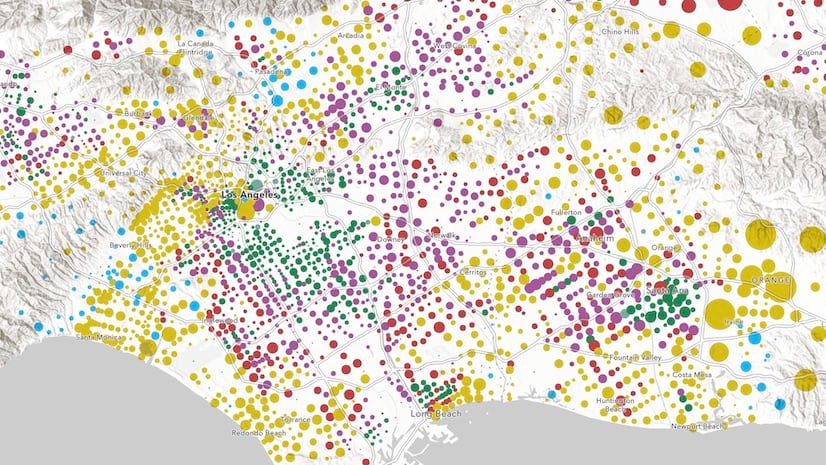
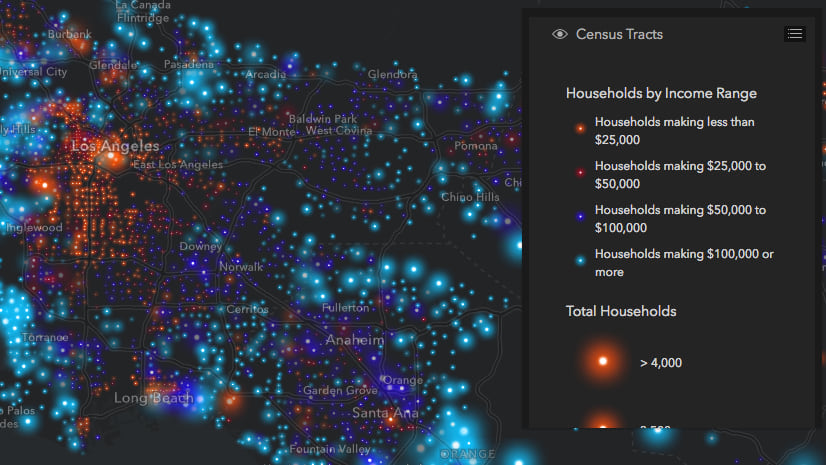
Building dynamic web applications with the ArcGIS API for JavaScript
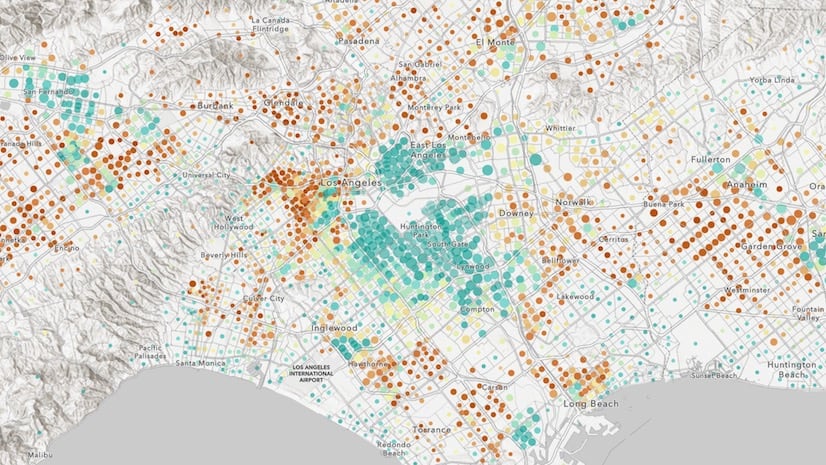
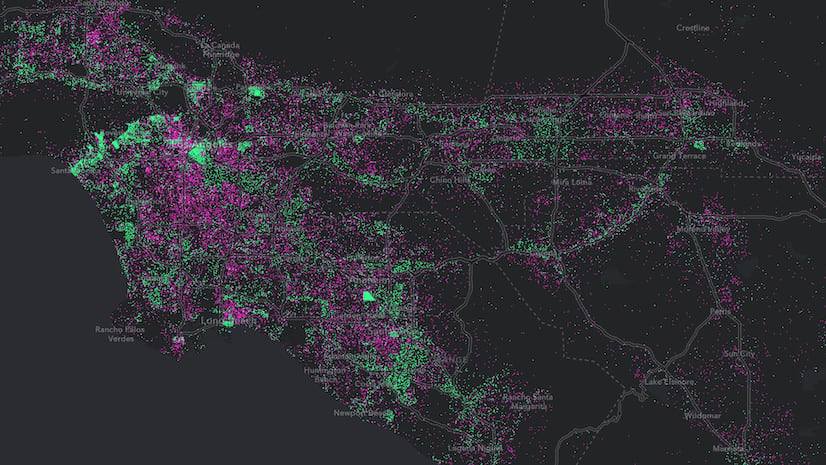
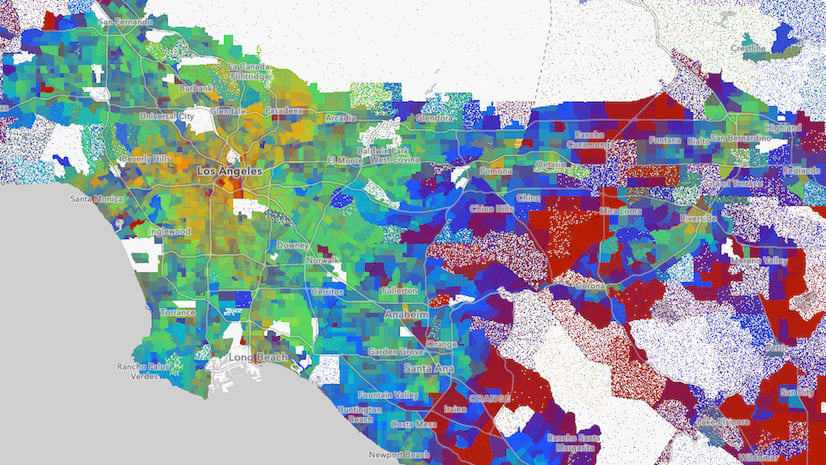
Anne Fitz | May 18, 2021
A deep dive into the development of an app from the DevSummit plenary built with the ArcGIS API for JavaScript exploring age and income in LA.

Six ways to visualize change over time in web maps
Kristian Ekenes | May 12, 2021
Explore six ways you can visualize change over time in web mapping applications.
Inset maps for the web
Kristian Ekenes | May 3, 2021
Inset maps have many uses in print maps, but do they have a place in web maps?
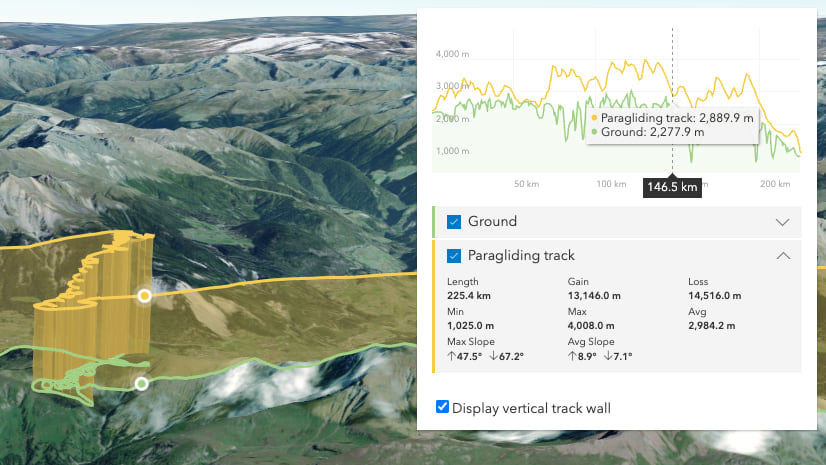
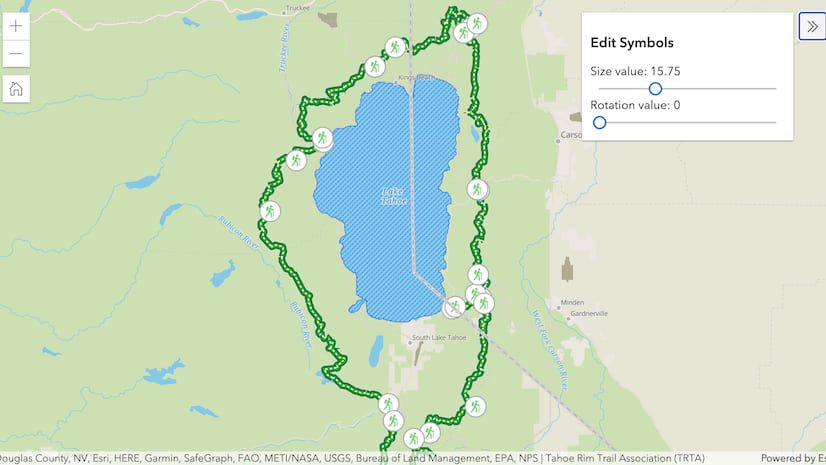
Map your outdoor activities in 3D with the elevation profile widget
Raluca Nicola | April 29, 2021
Ideas on creating 3D web visualizations of outdoor sport activities

JavaScript Just Works
Rene Rubalcava | April 26, 2021
It's never been easier to build modern web applications using the ArcGIS API for JavaScript. Trust me.

What’s New in ArcGIS API for JavaScript (version 4.19)
Julie Powell | April 22, 2021
Version 4.19 brings snapping, ES modules in production, performance improvements, shadow highlighting and a lot more. Check out the highlights!
ArcGIS API for JavaScript – Working with frameworks and build tools just got easier – Part 2
Andy Gup | April 22, 2021
The JS APIs ES modules modernize the experience of working with JS frameworks and build tools.
Data visualization in the ArcGIS API for JavaScript
Kristian Ekenes | April 22, 2021
Detailed conceptual guides are now available in the ArcGIS API for JavaScript documentation.

Web Developer’s Guide to the 2021 Esri Developer Summit
Julie Powell | April 4, 2021
Web developers have a LOT of great sessions to choose from this year at the 2021 DevSummit! This is a guide for planning your week.
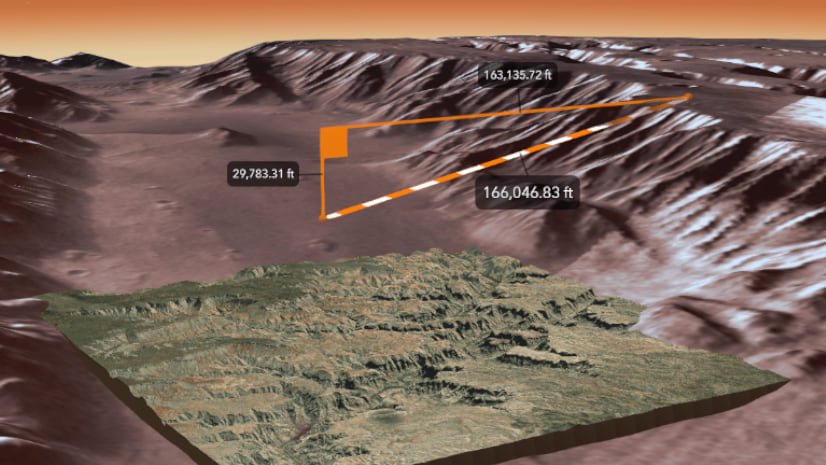
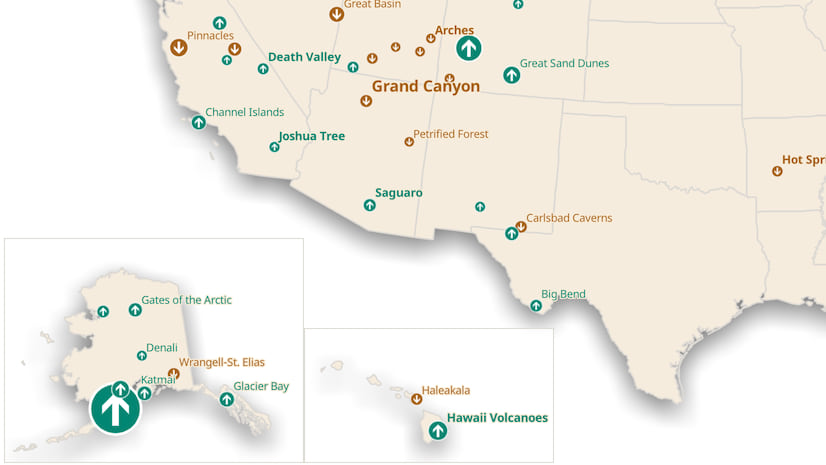
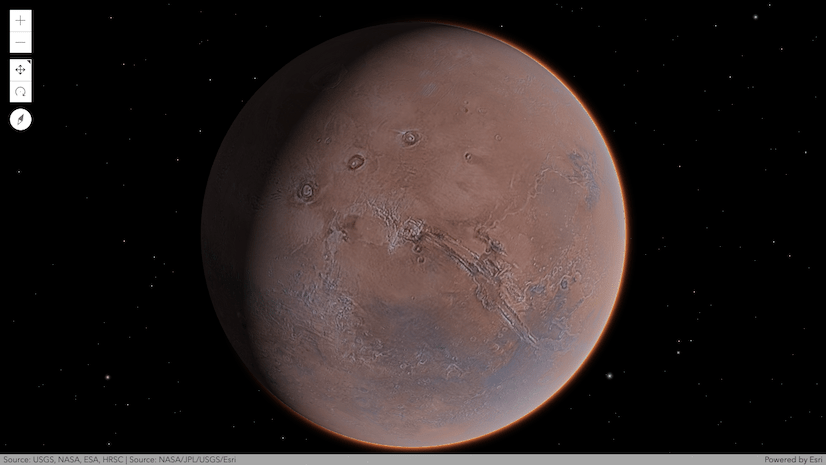
Explore Mars with GIS
Multiple Authors | February 18, 2021
3D Mars app from Esri: Compare the Grand Canyon with Valles Marineris; see previous landing sites and explore and understand Mars with GIS!
Esri Brings the Maps to Stanford TreeHacks
Multiple Authors | February 17, 2021
Esri awarded a prize of $1,000 for the best use of ArcGIS technology at Stanford University TreeHacks

Introducing the U.S. Vessel Traffic application from Living Atlas
Multiple Authors | February 16, 2021
The U.S. Vessel Traffic app, available in Living Atlas, lets you visualize, explore, and download vessel data in and around U.S. waters.
Visualize diverging datasets with size in web maps
Kristian Ekenes | February 3, 2021
Leverage the above-and-below color and size theme to visualize diverging datasets, such as change over time.
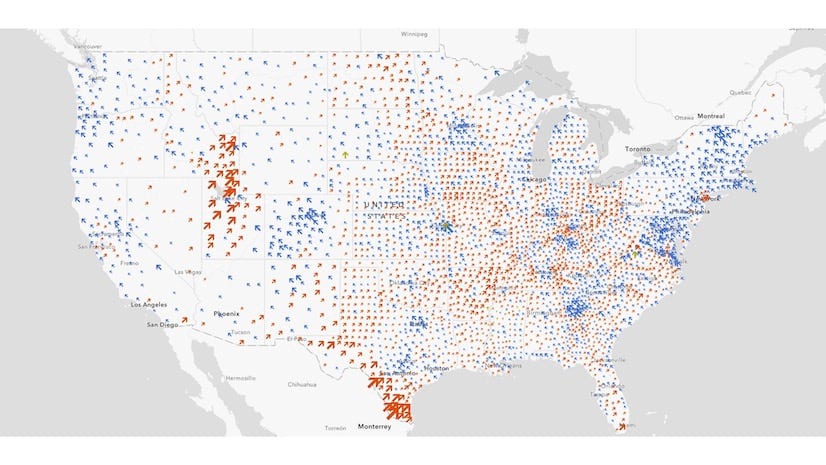
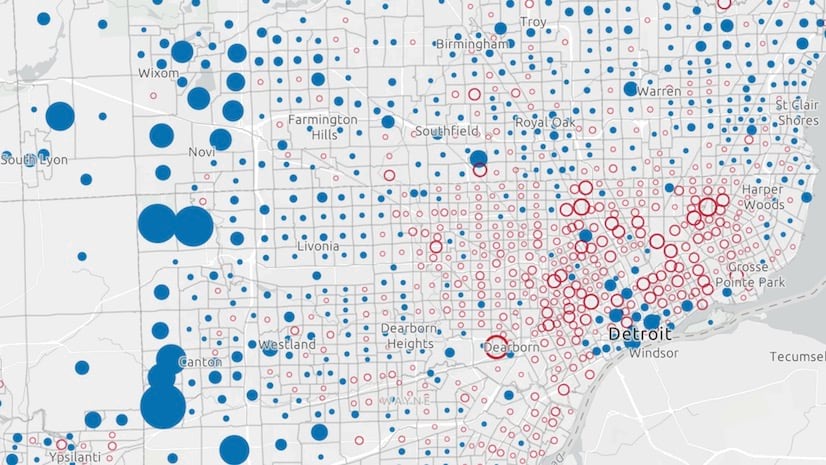
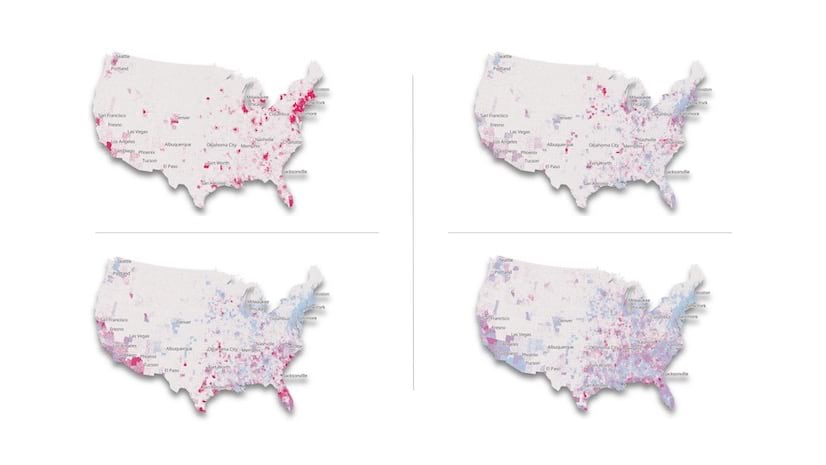
Electoral swing in the 2020 U.S. presidential election
Kristian Ekenes | January 20, 2021
Explore how voting patterns changed in U.S. presidential elections from 2000-2020.
Server Side Rendering Frameworks with @arcgis/core
Ben Elan | January 15, 2021
Examples and workflow for setting up the beta @arcgis/core ECMAScript Modules with Server Side Rendering Frameworks.
Summarize and explore point clusters in web apps
Kristian Ekenes | January 5, 2021
The ArcGIS API for JavaScript allows you to query point cluster features to display statistics, and other summary information to the user.
What’s New in the ArcGIS API for JavaScript (version 4.18)
Multiple Authors | December 17, 2020
Learn about the latest updates including ES modules, cluster queries, layer effects, improved transparency and underground navigation, and more.

Something in the water: the mythology of Snow’s map of cholera
Kenneth Field | December 3, 2020
A brief analysis of John Snow's research into cholera in Soho, London in 1854 and the role his famous map did or didn't play.

ArcGIS API for JavaScript – Working with frameworks and build tools just got easier
Andy Gup | November 3, 2020
The new ES modules will make it easier to integrate your ArcGIS API for JavaScript capabilities with 3rd party frameworks and module bundlers.

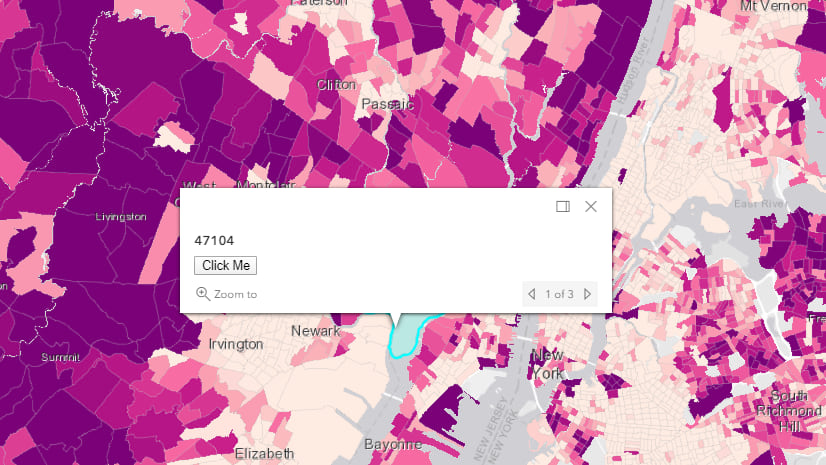
Pop-ups for Web Developers
Julie Powell | October 22, 2020
Learn about some of the subtle yet powerful capabilities of the pop-up that you can take advantage of as a developer.
What’s New in ArcGIS API for JavaScript (October 2020)
Multiple Authors | October 8, 2020
Learn about the latest advances in the JavaScript API, such as faster feature layers, more robust stream layers, and polygon fill patterns in 3D.
Visualize electoral swing using composite symbols
Kristian Ekenes | October 5, 2020
Use dynamic, scalable, composite symbols to map electoral swing in the next election.
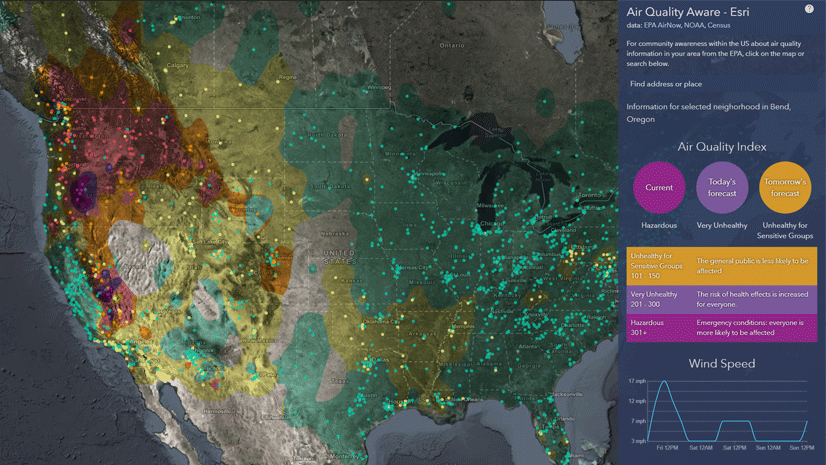
Access the Latest Air Quality and Human Impact Information with Air Quality Aware
Dan Pisut | September 18, 2020
A new application provides near real-time EPA air quality data along with potential demographic impacts for the USA.

How to create a sparkline map with the ArcGIS API for JavaScript
Multiple Authors | September 8, 2020
A look behind the scenes at the code used to render sparklines as map symbols in ArcGIS.
Generate popup templates for data exploration
Kristian Ekenes | September 1, 2020
Generate good default popup templates for unfamiliar layers in data exploration web apps.
3D camera intro using the ArcGIS API for JavaScript
Multiple Authors | August 20, 2020
In this blog post we’ll explain how to define a camera, how to retrieve it and how to animate the camera to another position in the scene.
Generate data for interactive charts using Arcade in popups
Kristian Ekenes | August 19, 2020
Generate a series of Arcade expressions to create a gallery of interactive charts in your popup.

So Long Internet Explorer 11, and Thanks for All the Views
Multiple Authors | August 16, 2020
The time has come for Esri to phase out support for Internet Explorer 11 in ArcGIS Online, ArcGIS Enterprise, and ArcGIS API for JavaScript
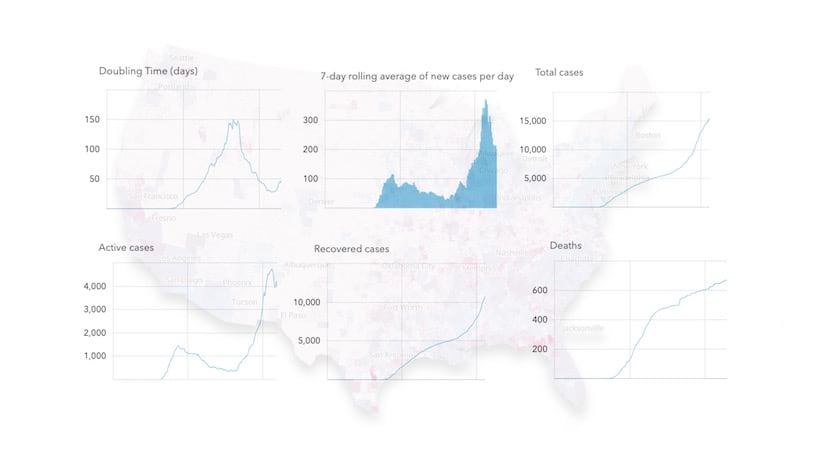
Animate and explore COVID-19 data through time
Kristian Ekenes | August 13, 2020
Combine the ArcGIS JS API's fast rendering capabilities with the TimeSlider to allow your users to animate and explore COVID-19 data through time
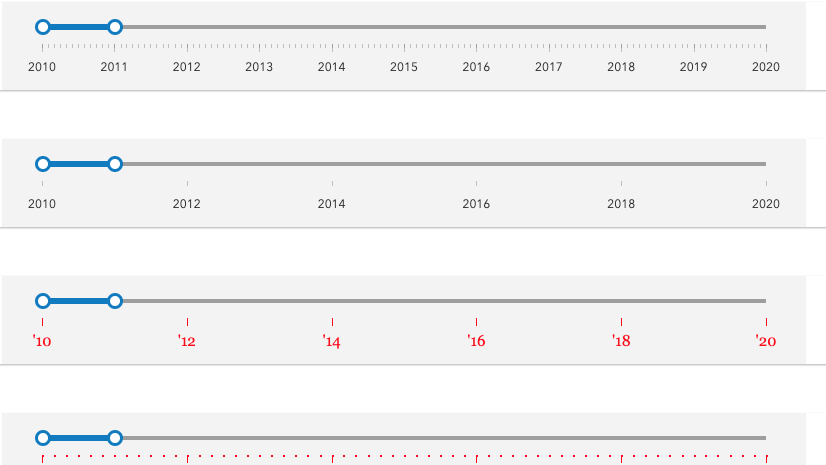
Applying custom ticks and labels for the TimeSlider widget
Undral Batsukh | August 4, 2020
This blog links to a video that shows how to customize the default labeling and ticks system for the TimeSlider widget

Retirement of alpha and beta versions of Esri Vector Tile Basemaps
Robert Jensen | July 30, 2020
Esri is completing the product life cycle of the early releases of vector tile basemaps by moving the items into Retirement on December 31, 2020.
Create points, lines, and polygons using CIMSymbols
Anne Fitz | July 24, 2020
Use CIMSymbols in the ArcGIS API for JavaScript to create custom vector point, line, and polygon symbols.
JavaScript Debugging Tips Part IV – Error Handling
Noah Sager | July 10, 2020
This blog post is the fourth in a series of JavaScript debugging tips and tricks to help you on your way.
Labeling support added to point clustering
Kristian Ekenes | July 9, 2020
The ArcGIS API for JavaScript added support for labeling point clusters with the total count or other aggregate summary information.
What’s new in the ArcGIS API for JavaScript (July 2020)
Julie Powell | July 9, 2020
Check out the new capabilities and enhancements in the ArcGIS API for JavaScript!
Web Developers Guide to the 2020 Esri Users Conference
Multiple Authors | July 2, 2020
Web developers attending the 2020 Esri UC will have a variety of ways to learn and explore the latest innovations.
Use Parts of the New Map Viewer to Build Your Own Web Apps
Julie Powell | June 30, 2020
Learn about how the new map viewer uses the ArcGIS API for JavaScript and how you can use the same capabilities in your own apps.

The Developer Experience at the 2020 Virtual User Conference
Amy Niessen | June 23, 2020
Plan your User Conference experience with developer Streaming Live and On-Demand sessions at the 2020 Virtual User Conference.
Your Arcade Questions Answered
Lisa Berry | June 10, 2020
Are you starting to learn how to use Arcade in your maps? If so, you might want to check out these commonly asked questions.
Capacity Analysis: a custom web mapping solution for understanding the impact of social distancing
Kristian Ekenes | May 5, 2020
Capacity Analysis is a new app demonstrating why custom web apps can be better solutions that generic web mapping software like ArcGIS Online.
Mapping large datasets on the web
Kristian Ekenes | April 27, 2020
Mapping large amounts of data on the web has always been a challenge. Learn techniques you can use to improve performance with large datasets.
DevSummit 2020 – ArcGIS API for JavaScript Recordings Available!
Julie Powell | April 24, 2020
This is a guide of the 2020 Developer Summit web development-focused technical session recordings.
Customize to Meet Your Unique Needs – ArcGIS Open Platform Series: Part 3
Adam Martin | April 24, 2020
This series highlights recent features related to data interoperability, enterprise integrations, and extensibility you might have missed.
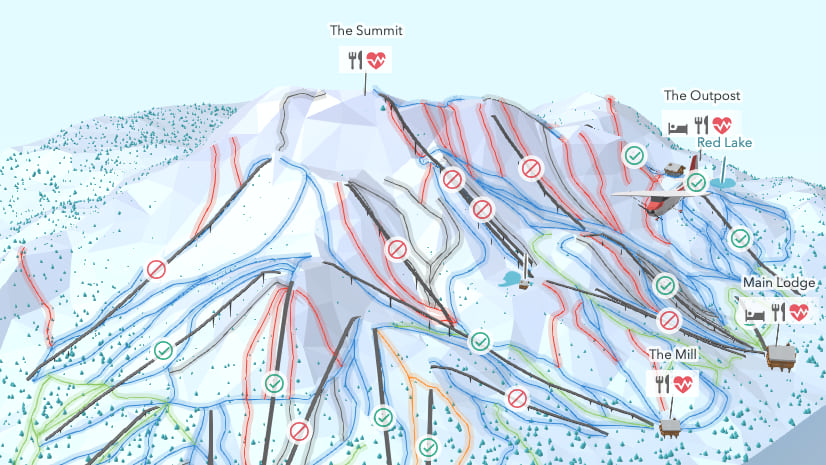
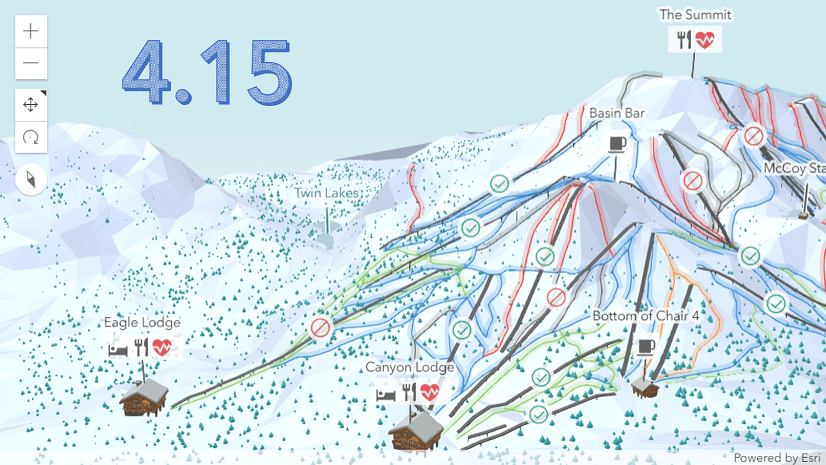
A low poly ski resort map – part II: add thematic data
Multiple Authors | April 22, 2020
This is the second part of a blog series explaining how to create a ski resort map in a low poly style with ArcGIS API for JavaScript.
A low poly ski resort map – part I: generating the terrain
Multiple Authors | April 22, 2020
This is the first part of a blog series explaining how to create a ski resort map in a low poly style with ArcGIS API for JavaScript.
Using HTML with Popups in the ArcGIS API for JavaScript
Ben Elan | April 10, 2020
How to use HTML in popups after a sanitzer was added to the ArcGIS Maps SDK for JavaScript in the v4.14 release.

Thoughts on creating 3D maps in low poly style
Raluca Nicola | April 10, 2020
Some thoughts on what low poly means and what are the characteristics of maps created in a low poly style.
What’s New in ArcGIS API for JavaScript (April 2020)
Multiple Authors | April 9, 2020
This API update introduces the ability to edit feature layers in 3D, a new feature table widget, viewing and editing of attachments, and more.
Writing Modern JavaScript with the ArcGIS API for JavaScript
Rene Rubalcava | March 26, 2020
A look at how you can use modern standard JavaScript syntax today with the ArcGIS API for JavaScript.
Training seminar available on leveraging ArcGIS Elevation Analysis Services
Jian Lange | March 10, 2020
Elevation Analysis services provide a group of capabilities for performing analysis against elevation data curated and hosted by Esri.
Using GeoJSON layers and more in the ArcGIS API for JavaScript
Julie Powell | February 13, 2020
Build web apps with striking visualizations and interactive workflows using a variety of data types with the ArcGIS API for JavaScript.

How and why to adjust symbol size by scale in web maps
Kristian Ekenes | January 29, 2020
Though subtle, icon and outline sizes varied by scale will turn a mediocre visualization into a great one.
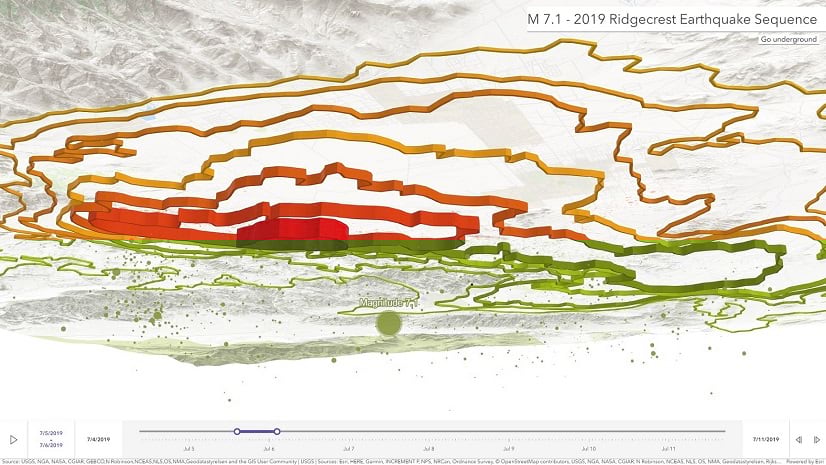
An in depth 3D globe of earthquakes
Raluca Nicola | January 26, 2020
Learn to create a 3D globe of earthquakes with exaggerated depth using ArcGIS API for JavaScript.

Better colors for better mapping
Kristian Ekenes | January 14, 2020
The Esri color ramps and Visualization Best Practices guide pages assist you in creating better maps using better combinations of colors.
Point clustering now available in ArcGIS JavaScript 4.x API
Kristian Ekenes | January 7, 2020
Clustering allows you to summarize and explore point layers as spatial clusters.

Showcase your BIM data in the Building Viewer
Multiple Authors | December 23, 2019
Leverage your BIM data to showcase the architecture, floors and interiors of a building, in an engaging intuitive website: the Building Viewer
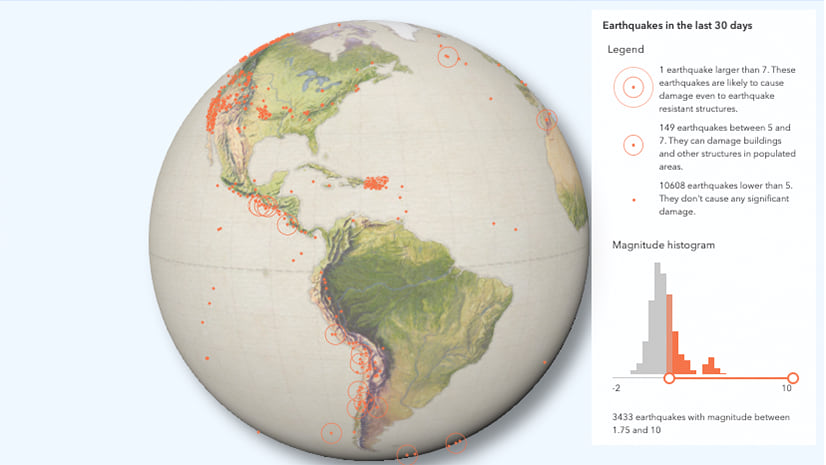
A classical visualization of earthquakes using ArcGIS API for JavaScript
Raluca Nicola | December 13, 2019
A blog post about creating an interactive 3D visualization of earthquakes using ArcGIS API for JavaScript

Clicking in a 3D web scene can do that?
Raluca Nicola | November 26, 2019
A blog post about interactivity in a 3D web scene with ArcGIS API for JavaScript's hitTest
A New Widget That’ll Have You Swiping Right
Anne Fitz | October 18, 2019
Swipe to view relationships between layers with the new Swipe widget, a useful tool for comparing layers.
Wurman Dots: Learning from the ’60s with a useful mapping style
Jennifer Bell | October 11, 2019
Discover a new way to visualize your data using Wurman Dots.
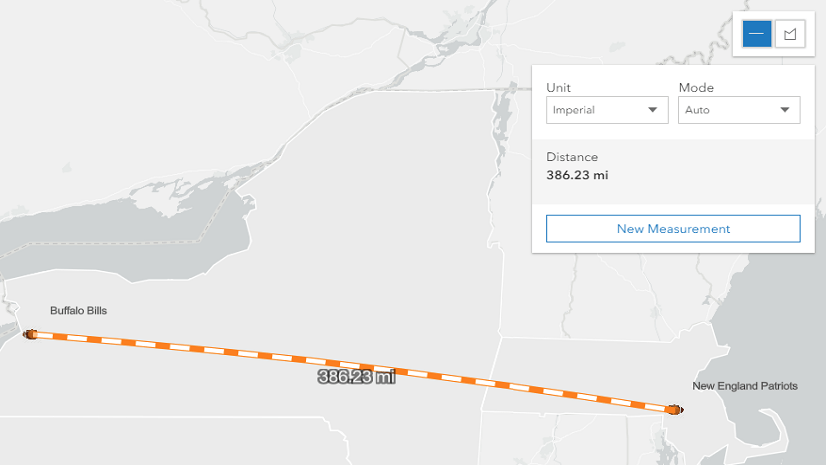
Measure Once with the new Measurement Widget
Noah Sager | October 10, 2019
New at version 4.13 of the ArcGIS API for JavaScript: the Measurement Widget. Works in 2D MapViews and 3D SceneViews.

What’s New in ArcGIS API for JavaScript (October 2019)
Multiple Authors | October 10, 2019
The October update to the ArcGIS API for JavaScript (versions 4.13 and 3.30) brings a lot to the table. Read this blog to find out more.
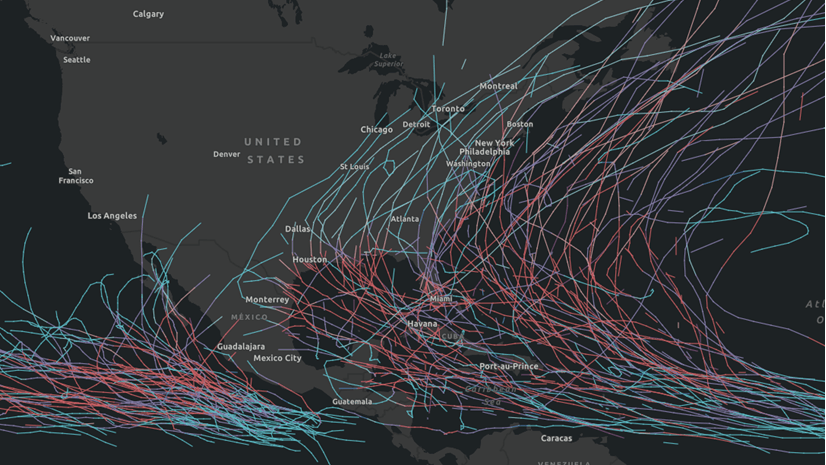
Use the Sea Ice Aware App to Monitor Conditions in the Poles
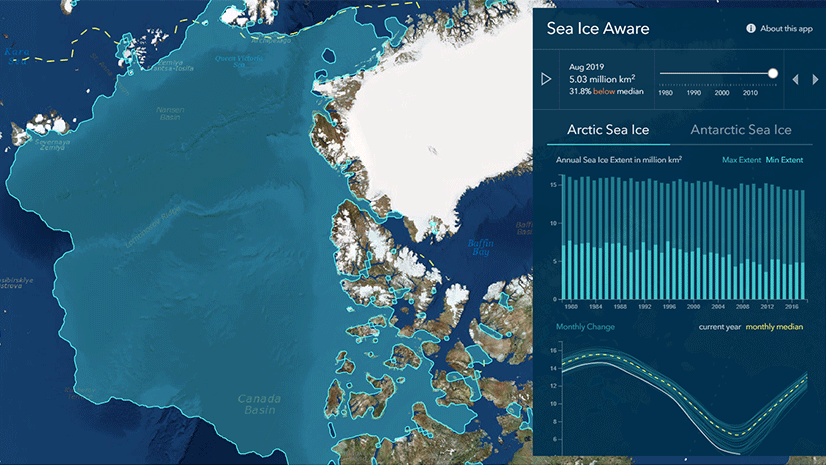
Dan Pisut | October 1, 2019
Gain knowledge of changes in the Arctic and Antarctic with a series of maps and graphs using authoritative sea ice information.
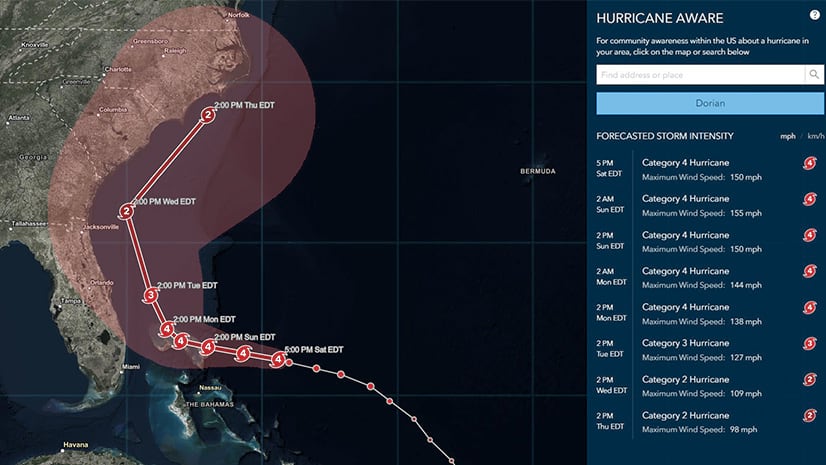
Understand Hurricane Forecasts and Impacts with the Hurricane Aware Application
Dan Pisut | September 3, 2019
The Hurricane Aware app provides the latest storm track and forecast along with localized weather and demographic impact analysis for the U.S.
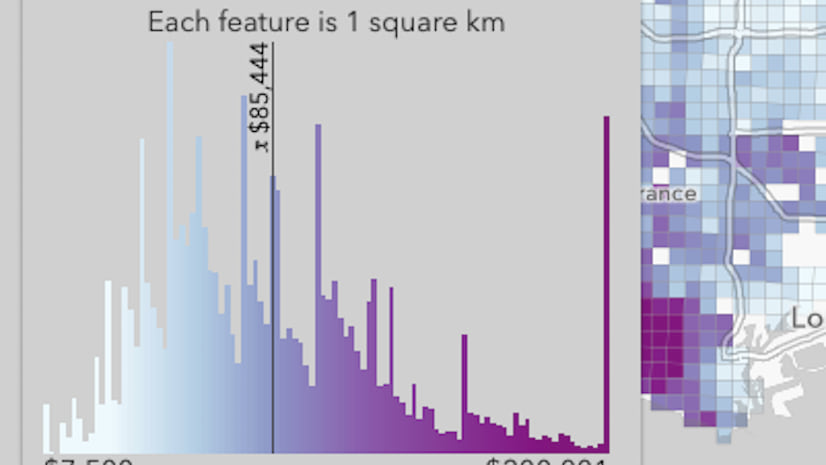
Make your histogram legendary
Kristian Ekenes | August 27, 2019
Add additional meaning and context to your data-driven map using a colored histogram instead of a legend.

An interactive 3D globe of extremes – a DIY mapping guide
Raluca Nicola | August 26, 2019
A tutorial on how to create an interactive 3D globe using ArcGIS API for JavaScript.

Interactive widgets for data exploration
Kristian Ekenes | August 7, 2019
The ArcGIS API for JavaScript provides more than a dozen easy-to-use widgets for data exploration.

ArcGIS Experience Builder Beta Is Available Now
Multiple Authors | July 29, 2019
ArcGIS Experience Builder provides users with a new way of creating web experiences. Easily transform your data into web apps and web pages.
Lifecycle for Esri’s hosted raster basemap services.
Robert Jensen | July 17, 2019
Esri hosts multiple raster basemap services that will enter Mature Support next year.

Useful code snippets for ArcGIS API for JavaScript
Multiple Authors | July 8, 2019
Discover how to use code snippets to speed up your ArcGIS API for JavaScript web app development.

What’s New in ArcGIS API for JavaScript (July, 2019)
Multiple Authors | July 2, 2019
Version 4.12 is here! Learn about the new time slider, smart mapping updates, 3D client-side querying, performance improvements, and more.

What’s in It for Devs at UC?
Amy Niessen | June 27, 2019
UC offers a wide variety of events and activities for developers. Here is a guide to find out where the developers should be all week!

Top 10 List for Web Developers at the 2019 Esri User Conference
Multiple Authors | June 24, 2019
This is a brief UC 2019 guide that covers key technical sessions and other developer-focused events that might be of interest to web developers.
Build a Tailored Web Editing Experience with the ArcGIS API for JavaScript
Julie Powell | June 21, 2019
Build a tailored web editing experience with the ArcGIS API for JavaScript using the latest capabilities
Visualizing change with dot density
Kristian Ekenes | April 25, 2019
Learn how to use dot density to visualize how population changes from nighttime to daytime.

Create your next neighborhood in 3D
Arno Fiva | April 25, 2019
Crowdsourcing with citizens: building a participatory planning app with a few simple steps using the ArcGIS API for JavaScript.
Visualizing growth with dot density
Kristian Ekenes | April 16, 2019
Learn how to build an interactive dot density map that animates the visibility of dots to create the perception of growth over time.

2019 DevSummit Top 20
Amy Niessen | April 15, 2019
If you missed out on DevSummit this year, or are just looking to re-live it, check out the Top 20 technical sessions.
Interactive dot density maps for the web
Kristian Ekenes | April 9, 2019
Add an interactive legend to your dot density map for data exploration purposes.
Hypnotic GIFs – Seven New ArcGIS Infographics Available
Kyle Watson | April 1, 2019
New infographic templates are now available in the March 2019 ArcGIS Online release.
Dot density for the web
Kristian Ekenes | April 1, 2019
Learn how to create dot density visualizations for web mapping applications using the ArcGIS API for JavaScript.
A Better Experience with the new ArcGIS API for JavaScript Website
Multiple Authors | March 29, 2019
Major redesign to the ArcGIS API for JavaScript website at version 4.11.
What’s New in ArcGIS API 4.11 for JavaScript (March 2019)
Multiple Authors | March 28, 2019
Check out what's new with the ArcGIS API for JavaScript version 4.11 and 3.28 (March 2019).
Q1 2019 ArcGIS Release
Dorothy Ho | March 20, 2019
Learn what's new in the latest ArcGIS release.
What’s New with OpenStreetMap Basemap (March 2019)
Deane Kensok | March 20, 2019
With the March update of ArcGIS Online, the OpenStreetMap vector basemap is now in full release and available to you through the basemap gallery.
Visualize large feature datasets in 3D with ArcGIS API for JavaScript
Multiple Authors | March 1, 2019
Learn how to visualize cities in 3D using large datasets of building footprints
New Mapping Experience Available for Developers
Vineet Sharma | January 17, 2019
ArcGIS for Developers offers an enhanced experience that brings the power of mapping to all developers with greater simplicity and flexibility.
Create powerful popups in web apps with Arcade feature sets
Kristian Ekenes | January 15, 2019
Feature sets allow you to access multiple features within an Arcade expression, enabling you to create powerful popup content.
Render millions of features in your maps
Rene Rubalcava | January 14, 2019
Take a large dataset into ArcGIS Online and create an awesome visualization of millions of points you can use in your web mapping applications!

Sketch your city with ArcGIS API for JavaScript
Raluca Nicola | January 11, 2019
Learn how to create an interactive 3D city sketch with ArcGIS API for JavaScript.
Choose Your Own Labeling Adventure
Noah Sager | January 2, 2019
Here we will take a look at the current labeling capabilities of the 4.x version of the ArcGIS API for JavaScript.
Hillshade Blending Sorcery via JavaScript API
John Nelson | December 20, 2018
Smash hillshade and imagery together with math on the fly in the browser to make cool maps.
Measure Twice with the new 2D Measurement Widgets
Noah Sager | December 13, 2018
At version 4.10 of the ArcGIS API for JavaScript you can measure distances, perimeters, and areas in 2D.
What’s New in ArcGIS API 4.10 for JavaScript (December 2018)
Multiple Authors | December 13, 2018
Check out what's new with the ArcGIS API for JavaScript version 4.10 (December 2018).
GeoDev Webinar Series: Using Arcade with Your Apps
Amy Niessen | December 8, 2018
Tune in to our GeoDev Webinar Series on December 19th and we present the latest on how to get the most out of this scripting language.

Using React with the ArcGIS API for JavaScript
Rene Rubalcava | December 4, 2018
A short overview of how to use React with the ArcGIS API for JavaScript to build your applications.
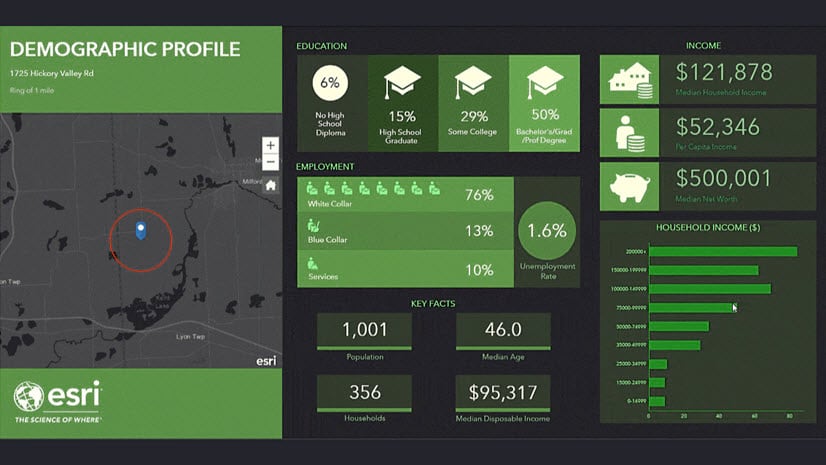
Use Business Analyst Infographics in Your Custom Applications
Multiple Authors | October 26, 2018
This blog helps you understand how to use the Business Analyst infographics capability available in the JavaScript API in your applications.

Using TypeScript with the ArcGIS API for JavaScript
Multiple Authors | October 16, 2018
Learn how to get started using TypeScript with ArcGIS API for JavaScript.
Functions aren’t fields; use Arcade instead
Kristian Ekenes | October 15, 2018
This post describes how you can re-write renderers using Arcade expressions instead of JavaScript functions.

Turbulence Ahead – Using ArcGIS API for JavaScript to Design and Evaluate a 3D Web-Based Aviation Weather Visualizer
Multiple Authors | October 15, 2018
Prototype to display weather forecast data in a 3D Web Application using the ArcGIS API for JavaScript.
Smart Mapping with Arcade: Visualizing predominance
Kristian Ekenes | October 10, 2018
Generate a predominance visualization in a web app using Smart Mapping in the ArcGIS API for JavaScript
Smart Mapping with Arcade: Exploring relationships
Kristian Ekenes | October 8, 2018
Explore two attributes in a relationship visualization (bivariate choropleth) using the Smart Mapping relationship module.
Smart Mapping with Arcade: Exploring age
Kristian Ekenes | October 3, 2018
Use the Smart Mapping renderer creator modules to build apps for exploring age in layers containing date fields.
Generating Arcade expressions: what Smart Mapping does for you
Kristian Ekenes | October 1, 2018
New Smart Mapping modules generate Arcade expressions under the hood, allowing you to create complex visualizations with just a few lines of code

Improved map and scene navigation with gamepad support
Multiple Authors | September 27, 2018
Use gamepad for an improved map and scene navigation experience.
ArcGIS API 4.9 for JavaScript: What’s new (September 2018)
Julie Powell | September 27, 2018
What's New in the ArcGIS API for JavaScript (September 2018), version 4.9
Now Showing in 3D: MapImageLayer
Noah Sager | September 6, 2018
Use 3D symbology with the MapImageLayer class and the 4.x version of the ArcGIS API for JavaScript.
Build web apps for exploring data in dynamic workspaces
Kristian Ekenes | September 4, 2018
With Smart Mapping, you can build data exploration web apps for layers created from dynamic workspaces.
Migrating Web Apps from Google to ArcGIS: Adding a Shape
Multiple Authors | August 30, 2018
Fourth post in a series related to migrating Google Maps apps to the ArcGIS API for JavaScript
Migrating Web Apps from Google to ArcGIS: Searching and Geocoding
Multiple Authors | August 23, 2018
This is the third post in a four-part series covering the basic topics related to migrating your app built with the Google to ArcGIS.
Migrating Web Apps from Google to ArcGIS: Directions and Routing
Multiple Authors | August 17, 2018
This post is about migrating your routing and directions app built with the Google Maps JavaScript API to the ArcGIS API for JavaScript
Migrating from Google Maps JavaScript API to ArcGIS API for JavaScript
Multiple Authors | August 9, 2018
Learn how you can migrate your app built with the Google Maps JavaScript API to the ArcGIS API for JavaScript.
Turbo charge your web apps with client-side queries
Multiple Authors | August 6, 2018
Enhance the interactivity of data exploration web apps by allowing your users to query features already available on the client.
Get creative with globe visualizations
Raluca Nicola | July 20, 2018
Visualize global data on an interactive web 3D globe

City visualizations on the edge with ArcGIS API for JavaScript
Raluca Nicola | July 12, 2018
Find out how we used edge rendering to create better city visualizations with ArcGIS API for JavaScript
New OpenStreetMap Vector Basemap Available
Deane Kensok | July 9, 2018
Esri is introducing a new OpenStreetMap Vector Basemap built using OSM data that will be freely available to users and developers.

3D things to look for at the 2018 User Conference
Chris Andrews | July 8, 2018
Take a look at some of the highlights for 3D at the 2018 Esri International User Conference!
Introduction to labeling in 2D with ArcGIS JavaScript API 4.8
Multiple Authors | July 5, 2018
New at version 4.8 of the ArcGIS API for JavaScript, you can now label 2D FeatureLayers and CSVLayers with WebGL!

What’s New in the ArcGIS API for JavaScript (version 4.8 & 3.25)
Multiple Authors | July 5, 2018
ArcGIS API 4.8 for JavaScript is packed with new capabilities, enhanced performance and provides developers with more styling options & features
What is a Relationship Map?
Lisa Berry | June 26, 2018
The Relationship style is a new way to compare two data patterns within a single map. Learn what a relationship map can tell you about your data.
Better Breaks Define Your Thematic Map’s Purpose
Jim Herries | June 26, 2018
The purpose of this blog is to discuss how a typical thematic map of a percentage comes into focus and how you give it purpose.
Introducing a cli for the ArcGIS API for JavaScript
Multiple Authors | June 21, 2018
Learn how to use the new @arcgis/cli to quickly create applications and widgets for the ArcGIS API for JavaScript today!

Web Development Session Guide to the 2018 UC
Multiple Authors | June 19, 2018
The 2018 Esri UC in San Diego, CA is right around the corner. Check out this blog to find the relevant technical sessions for Web Development.

Generate Arcade expressions for data exploration web apps
Kristian Ekenes | June 5, 2018
You don't need an expression builder to take advantage of Arcade as a developer. You can generate expressions in behalf of your users.
Scene Layer Performance in Scene Viewer, Part 2
Stefan Eilemann | June 5, 2018
Reduced Memory Usage, Global Memory Management and Continuous Loading in the ArcGIS API for JavaScript version 4.7
Fun facts about creating an interactive 3D hiking map
Raluca Nicola | May 26, 2018
A blog post about creating an interactive 3D hiking map of the Swiss National Park using ArcGIS API for JavaScript.
How to Publish Web Styles with 3D Symbols
Russell Roberts | May 21, 2018
Did you know you can create your own 3D symbol galleries in ArcGIS Online?
Add power and context to your web apps with LayerList panels
Kristian Ekenes | May 15, 2018
LayerList panels allow you to add custom content for each layer, including HTML elements and widgets, providing interactivity to your web apps.
What’s the Deal with MapImageLayer?
Noah Sager | May 8, 2018
Learn more about dynamic layers and the exciting MapImageLayer class with the 4.x version of the ArcGIS API for JavaScript.

Using the new webpack plugin for the ArcGIS API for JavaScript
Multiple Authors | April 27, 2018
Learn how to use the new @arcgis/webpack-plugin to help you build your own bundled apps with webpack and the ArcGIS API for JavaScript today!
Build 3D web apps with your 2D data
Kristian Ekenes | April 24, 2018
Are you reluctant to build 3D web apps because you don't have 3D data? Look no further than the 2D data sources already available to you.
Introducing client-side projection engine
Undral Batsukh | April 23, 2018
Client-side projection engine converts geometries from one spatial reference to another without making network requests.

ArcGIS API for JavaScript versions 4.7 and 3.24 released
Multiple Authors | April 19, 2018
Versions 4.7 and 3.24 of the ArcGIS API for JavaScript have released! Check out this blog for more details.
Share your Arcade expressions as templates
Kristian Ekenes | March 15, 2018
Providing a mechanism for sharing Arcade expressions has been a popular request.
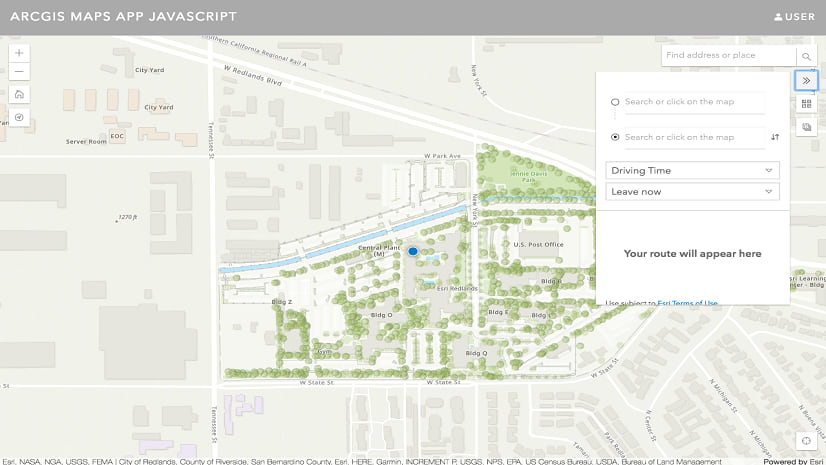
Maps App JavaScript
Multiple Authors | February 26, 2018
Example App: Maps App JavaScript The ArcGIS for Developers Example Apps are a great way to start working with the ArcGIS Platform through...

Web Development Session Guide to the 2018 Developer Summit
Multiple Authors | February 21, 2018
The 2018 Esri Developer Summit in Palm Springs, CA is right around the corner. It will feature a lineup of more than 50 technical session...
Scene Layer Performance in Scene Viewer, Part 1
Simon Reinhard | February 13, 2018
You can use 3D object and integrated mesh scene layers based on the OGC® I3S Community Standard to create compelling visualizations dir...

Web AppBuilder for ArcGIS v2.7 Developer Edition Now Available!!
Derek Law | January 11, 2018
FYI: Web AppBuilder for ArcGIS v2.7 Developer Edition is now available for download from the ArcGIS Developer’s Site. This update i...
Tips and Tricks for Navigating the ArcGIS API for JavaScript Website
Noah Sager | December 28, 2017
At version 4.0, we didn't just rebuild the API to make it stronger and more efficient, we also rebuilt the SDK to make it easier for deve...
ArcGIS API for JavaScript – Improved Website Accessibility
Multiple Authors | December 21, 2017
At version 4.6 (and 3.23), we introduced some website enhancements that included Keyboard Accessibility support to the Home, Guide, and more.
Improved TypeScript development with ArcGIS API for JavaScript
Undral Batsukh | December 14, 2017
The TypeScript declaration file for the ArcGIS API for JavaScript contains type information specific for the API. You can learn more abou...

Making Better Promises
Multiple Authors | December 14, 2017
This blog post will discuss a change to our implementation of promises, a change towards making a better promise.
ArcGIS API for JavaScript versions 4.6 and 3.23 released
Multiple Authors | December 14, 2017
Just in time for the new year, Versions 4.6 and 3.23 of the ArcGIS API for JavaScript have arrived, bringing new capabilities such as a ...
Creating a custom tile layer with TypeScript
Undral Batsukh | October 27, 2017
The ArcGIS API for JavaScript provides you with many different layer types that support various data types and visualizations. We also pr...

Unwinding the Clock: Visualizing Time with Arcade
Kristian Ekenes | October 18, 2017
Recording times and dates can be invaluable during the data collection phase of a project.
Web AppBuilder for ArcGIS v2.6 Developer Edition Now Available!
Derek Law | October 12, 2017
FYI: Web AppBuilder for ArcGIS v2.6 Developer Edition is now available for download from the ArcGIS Developer’s Site. This release in...
Thematic point clustering for data exploration
Kristian Ekenes | October 11, 2017
Extracting meaningful information from large or dense point datasets can be challenging. Sometimes many points aren't visible because the...
Speed up your JavaScript development with autocasting
Raluca Nicola | October 4, 2017
In the 4.5 release of the ArcGIS API for JavaScript, autocasting support was expanded to all renderers, symbols, and symbol layers. This ...
FeatureLayer rendering: taking advantage of WebGL in 2D
Kristian Ekenes | September 29, 2017
The 4.5 version of the ArcGIS API for JavaScript allows users to opt in to rendering FeatureLayer with WebGL (beta) in 2D MapViews. This ...
ArcGIS API for JavaScript versions 4.5 and 3.22 released
Multiple Authors | September 29, 2017
Version 4.5 of the ArcGIS API for JavaScript adds some key capabilities and several smaller (but sweet) enhancements that will come in ha...
React Redux: Building Modern Web Apps with the ArcGIS JS API
Michael Van den Bergh | September 8, 2017
I would like to share my experience building a React Redux app with the ArcGIS API for JavaScript (ArcGIS JS API). It is exciting how wel...
Mapping art in 3D
Raluca Nicola | September 5, 2017
I regularly check the Open Data portals because there's always some new, interesting dataset out there. Recently, I stumbled upon data of...
Exploring 3D object data in a custom web app
Kristian Ekenes | August 15, 2017
In a session titled 3D Visualization with the ArcGIS API for JavaScript at the 2017 Esri User Conference (UC), Javier Gutierrez and I dem...
Web AppBuilder for ArcGIS v2.5 Developer Edition Now Available!
Derek Law | July 18, 2017
Following on last week’s busy User Conference, we are happy to announce that Web AppBuilder for ArcGIS v2.5 Developer Edition is now av...
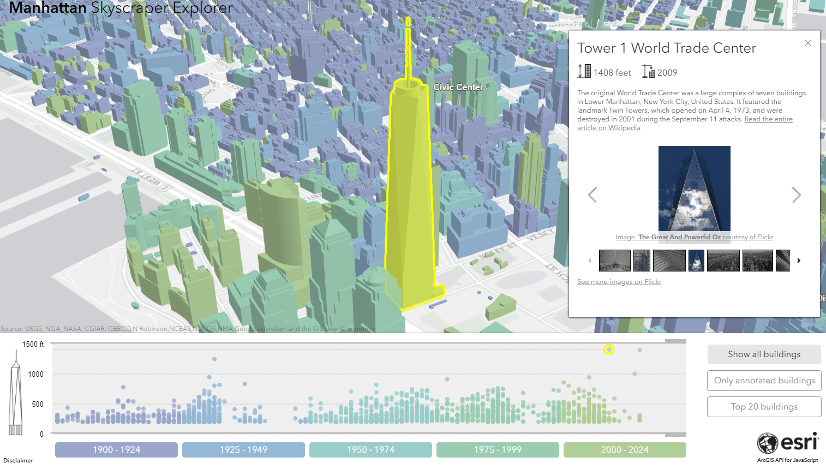
Manhattan Skyscraper Explorer – when Open Data and ArcGIS API for JavaScript meet
Raluca Nicola | July 14, 2017
Open data is an awesome thing nowadays. It's amazing how many organizations publish their data to allow citizens to learn more about the ...
ArcGIS API for JavaScript Versions 4.4 and 3.21 Are Here!
Multiple Authors | July 5, 2017
The latest releases of the ArcGIS API for JavaScript are packed with useful new enhancements and capabilities. Version 4.4 gives you more...
Creating a predominance visualization with Arcade
Kristian Ekenes | May 23, 2017
At the March 2017 Esri Developer Summit, Dave Bayer and I gave a presentation on how to use Arcade expressions in web apps built on the A...
Creating a Custom Widget for Web AppBuilder for ArcGIS using the Report Class
Derek Law | April 18, 2017
This blog post was contributed by Artemis Fili, a Technical Lead (SDK Team) in Technical Support Services at the Esri Redlands, CA office...
Visualizing data in web apps: leveraging the platform
Kristian Ekenes | April 13, 2017
The ArcGIS API for JavaScript contains powerful visualization capabilities that bring your data to life on the web. Some of these include...
C-Through – A Prototype for Interactive 3D Urban Planning Analysis on the Web
Lisa Staehli | April 12, 2017
An interactive 3D web-based application based on the ArcGIS JavaScript API aiming to support decision making in urban planning.
Take advantage of the JavaScript symbol playground
Kristian Ekenes | March 28, 2017
The 4.3 release of the ArcGIS API for JavaScript introduced an app called the Symbol Playground. Its purpose is to provide an environment...
ArcGIS API for JavaScript 4.3 and 3.20 released
Multiple Authors | March 3, 2017
We are excited to announce the releases of both the 4.3 and 3.20 versions of the ArcGIS API for JavaScript. Version 4.3 continues to buil...
Styler: A new configurable app template for creating 2D and 3D map apps
Allan Laframboise | March 3, 2017
DevSummit Technical Session Guide for the Web Developer
Julie Powell | February 27, 2017
The 2017 Esri Developer Summit in Palm Springs, CA is right around the corner! It will feature a lineup of more than 50 technical sessio...
Enliven your web apps with custom actions
Kristian Ekenes | February 6, 2017
The 4.x series of the ArcGIS API for JavaScript introduced the concept of actions. An action is a task that can be triggered by a user by...
The Esri community and JavaScript Team at Esri
Multiple Authors | January 11, 2017
We love getting direct feedback from our user community! The purpose of this blog post is to introduce users of the ArcGIS API for JavaSc...
Using Arcade expressions in web apps
Kristian Ekenes | January 10, 2017
At the end of 2016 Esri released Arcade, a light-weight scripting language designed to evaluate expressions in labeling and rendering con...
ArcGIS API for JavaScript 4.2 released
Multiple Authors | December 21, 2016
The ArcGIS API for JavaScript 4.2 is available, introducing new widgets, smart mapping in 2D and 3D, vector tiles in 3D, support for Arca...
ArcGIS API for JavaScript 3.19 released
Multiple Authors | December 21, 2016
The ArcGIS API for JavaScript 3.19 is now available, allowing you to write Arcade expressions for custom visualizations and labels, and ...
What’s Coming in the ArcGIS API 4.2 for JavaScript
Julie Powell | December 9, 2016
We are in the home stretch preparing the next 4.x release of the ArcGIS API for JavaScript. Here are a few highlights about the release t...
ArcGIS API for JavaScript Version 3.18 released
Multiple Authors | September 23, 2016
The ArcGIS API for JavaScript 3.x series continues to support a breadth of ArcGIS web apps and of course many of your apps. We are active...
ArcGIS API for JavaScript 4.1 Released
Multiple Authors | September 22, 2016
The second release in the 4.x series of the ArcGIS API for JavaScript is now available. Our next-generation JS API continues along its pa...
Web AppBuilder for ArcGIS v2.1 Developer Edition Now Available!
Derek Law | July 19, 2016
We had a very busy 2016 Esri User Conference in San Diego last month, where we met with many folks from the Web AppBuilder user community...
ArcGIS API for JavaScript Version 3.17 released
Multiple Authors | June 23, 2016
The ArcGIS API for JavaScript version 3.17 is available today. This release drives many of the new features released in the ArcGIS Online...
Play in the JavaScript symbol playground
Kristian Ekenes | June 22, 2016
Version 3.15 of the ArcGIS API for JavaScript introduced a convenient new app called the Symbol Playground to help developers create symb...
What’s New in Web AppBuilder for ArcGIS (June 2016)
Derek Law | June 16, 2016
This update has many new and exciting features - many have been requested many times from our users. We've listened to the Web AppBuilder...
Web AppBuilder for ArcGIS at UC 2016
Derek Law | June 10, 2016
It’s that time of year again when “geospatial-minded” techies gather together to learn about GIS! The 2016 International Esri User ...
Smart Mapping with dynamic workspaces
Kristian Ekenes | May 25, 2016
Not too long ago I wrote a post about how and why you may want to use Smart Mapping in custom web apps using the ArcGIS API for JavaScrip...
It’s here! ArcGIS API for JavaScript 4.0 Released
Multiple Authors | May 3, 2016
It is with great pleasure we announce the first release of the 4.x series of the ArcGIS API for JavaScript. You can now starting building...
Increased web API security in Google Chrome
Matt Driscoll | April 14, 2016
Starting with Google Chrome version 50, some of the HTML5 web APIs will require websites to be using a secure origin like HTTPS to w...
Web AppBuilder for ArcGIS v2.0 Developer Edition Now Available!
Derek Law | March 31, 2016
We are pleased to announce the release of Web AppBuilder for ArcGIS Developer Edition v2.0, which is now available from the ArcGIS Develo...
Using Smart Mapping in custom web apps
Kristian Ekenes | March 28, 2016
Smart Mapping was released last year in the ArcGIS API for JavaScript, ArcGIS Online, and Portal for ArcGIS, providing easy-to-use tools ...
ArcGIS API for JavaScript Version 3.16 released
Multiple Authors | March 4, 2016
The ArcGIS API for JavaScript version 3.16 was released today deploying several new features, enhancements, and bug fixes. Headlining thi...
What’s New in Web AppBuilder for ArcGIS (March 2016)
Derek Law | February 29, 2016
The latest ArcGIS Online update of Web AppBuilder for ArcGIS includes many new capabilities that offer you even more options for creating...
3D visualization: Using attributes to represent real-world sizes of features
Kristian Ekenes | February 1, 2016
This is the final post in a three-part series exploring 3D data-driven visualizations in web applications using the ArcGIS API for JavaSc...
Web AppBuilder for ArcGIS Developer Edition Now Supports 3D (Beta)!!
Derek Law | January 29, 2016
We are pleased to announce the release of Web AppBuilder for ArcGIS Developer Edition v2.0 Beta. You can now bring 3D into your own web a...
3D visualization: working with objects, paths, and extrusion
Kristian Ekenes | January 25, 2016
This is the second post in a three-part series exploring 3D data visualization in web applications using the ArcGIS API for JavaScript ve...
3D visualization: working with icons, lines, and fill symbols
Kristian Ekenes | January 19, 2016
This is the first post in a three-part series exploring 3D attribute-based visualizations in web applications using the ArcGIS API for Ja...
Multivariate Rendering – 2D visualization techniques in JavaScript
Kristian Ekenes | January 11, 2016
Smart Mapping was added to the ArcGIS API for JavaScript in version 3.13 to provide web developers with an easy way to generate renderers...
ArcGIS API for JavaScript 4.0 beta 3 released
Multiple Authors | December 17, 2015
We are excited to announce that beta 3 of the ArcGIS API for JavaScript 4.0 is now available. The following are some of the highlights o...
Web AppBuilder for ArcGIS v1.3 Developer Edition Available This Week!
Derek Law | December 9, 2015
We would like to announce that Web AppBuilder for ArcGIS v1.3 Developer Edition, will be available for download this week from the ArcGI...
ArcGIS API for JavaScript Version 3.15 released
Multiple Authors | December 1, 2015
Version 3.15 of the ArcGIS API for JavaScript introduces vector tiles, better maps through predominance renderers, legend improvements, a...
ArcGIS API for JavaScript 4.0 beta 2 released
Multiple Authors | November 19, 2015
We are excited to announce that beta 2 of the ArcGIS API for JavaScript 4.0 is now available. We have been busy working on adding functi...
Using Bower for custom builds of ArcGIS API for JavaScript
Multiple Authors | November 13, 2015
Esri recently released a Bower package to enable local custom builds of the API. The advantage of using a custom build is that your app...
What’s New in Web AppBuilder for ArcGIS (November 2015)
Derek Law | November 12, 2015
Chicago Black Hawks - Hockey. FC Barcelona and the US National Women’s Team - Soccer. Kansas City Royals - Baseball. The All Blacks - R...
GeometryEngine part 3: Overlay analysis
Kristian Ekenes | September 23, 2015
This is the final post in a three-part series exploring the client-side GeometryEngine in the ArcGIS API for JavaScript. This series cov...
GeometryEngine part 2: Measurement
Kristian Ekenes | September 16, 2015
This is the second post in a three-part series exploring the client-side GeometryEngine in the ArcGIS API for JavaScript. This series co...
GeometryEngine part 1: Testing spatial relationships and editing
Kristian Ekenes | September 9, 2015
This is the first post in a three-part series exploring GeometryEngine in the ArcGIS API for JavaScript. This series will cover the follo...
Web AppBuilder for ArcGIS v1.2 Developer Edition Available This Week!
Derek Law | August 10, 2015
We would like to announce the forthcoming release of Web AppBuilder for ArcGIS v1.2 Developer Edition, which will be available for downlo...
ArcGIS JavaScript Promises and Web Mobile (Part 1)
Andy Gup | August 6, 2015
Promises, promises . Major changes coming at ya here in the next major release of ArcGIS API for JavaScri...
ArcGIS API for JavaScript 4.0 beta 1 – available today
Multiple Authors | July 16, 2015
Version 4.0 is the next generation ArcGIS API for JavaScript and it supports both 2D and 3D. Today we are announcing the first beta vers...
ArcGIS API for JavaScript Version 3.14 Released
Multiple Authors | July 15, 2015
The 3.14 version of the ArcGIS API for JavaScript is now available, which adds more than 30 new classes, dozens of bug fixes, and other e...
Web AppBuilder for ArcGIS at UC 2015
Derek Law | July 13, 2015
Can you feel the anticipation and GeoGeek excitement? The 2015 Esri International User Conference (July 20–24) is one week away and the...
Opening New Possibilities with Operations Dashboard for ArcGIS
Jeff Shaner | July 8, 2015
The version 10.3.1 release of Operations Dashboard for ArcGIS opens up new possibilities for you to create and share powerful, focused da...
What’s Coming in Web AppBuilder for ArcGIS in the ArcGIS Online July update
Derek Law | June 29, 2015
The number “5” is unique and has some special significance … In numerology, it is the most dynamic and energetic single-digit num...
Clarifying 3 questions about Web AppBuilder for ArcGIS
Derek Law | April 6, 2015
Web AppBuilder for ArcGIS enables you to create new custom web mapping applications in an intuitive, easy to use, WYSIWYG wizard-like env...
Web AppBuilder for ArcGIS v1.1 Developer Edition Now Available!
Derek Law | March 26, 2015
Web AppBuilder for ArcGIS enables you to create and deploy new custom web apps that can run on any device without programming. Built on t...
ArcGIS API for JavaScript Version 3.13 Released
Multiple Authors | March 6, 2015
Version 3.13 of the ArcGIS API for JavaScript is now available! Below is an overview of the release including new features, enhancements,...
Esri’s Roadmap for Web Developers
Julie Powell | February 21, 2014
This post is designed to provide clarity on the future of our Flex and Silverlight development efforts. In order to align our product roa...
10 open source projects every JavaScript geo dev should know about
Allan Laframboise | January 23, 2014
Regardless of whether you’re a hacker or a well-seasoned developer, writing JavaScript geo apps from scratch takes some serious time
Esri picture marker symbol generator for JavaScript developers
ArcGIS Server Development Team | February 3, 2012
The ArcGIS.com map viewer provides a nice collection of picture marker symbols that can be used to symbolize features on your map.
ArcGIS API for JavaScript �– Basic Viewer template now available
kelly | October 11, 2011
We recently added a new JavaScript application template to ArcGIS.com called the Basic Viewer. Using ArcGIS.com and the Basic Viewer template
Cross Origin Resource Sharing (CORS) with the ArcGIS API for JavaScript
kelly | September 29, 2011
ersion 2.5 of the ArcGIS API for JavaScript introduced support for cross-origin resource sharing (CORS).
High performance web apps with big datasets as feature layers
ArcGIS Server Development Team | June 29, 2011
Dealing with big datasets is a frequent topic of discussion among web mapping app developers
Add data from a CSV file to any ArcGIS Online map
Bern Szukalski | September 22, 2010
take a closer look at one of those samples, one that enables you to add data from any CSV file to any ArcGIS Online map.

Measuring distances and areas when your map uses the Mercator projection
ArcGIS Server Development Team | March 5, 2010
Recently, ArcGIS Online services became available in the same “Web Mercator” projection used by Google Maps and Bing Maps.
Find graphics under a mouse click with the ArcGIS API for JavaScript
kelly | February 8, 2010
Mapping applications built with the ArcGIS API for JavaScript commonly allow users to click or hover over a map and get information
Looping through graphics using the ArcGIS API for JavaScript
kelly | November 11, 2009
When working with the ArcGIS API for JavaScript you’ll often find yourself looping through arrays, like the collection of graphics stored
Working with TextSymbol in the ArcGIS JavaScript API
kelly | October 26, 2009
This post discusses how you can add text to your map using the ArcGIS JavaScript API. Your map service probably already has some labeling in it.
ArcGIS RIA Developers: Tips on using cross-domain policy files – Part 1 (Intro)
Andy Gup | September 10, 2009
If you have spent any time with Adobe Flex or Microsoft Silverlight, there is an excellent chance you have encountered errors
A technical walk-through for a simple utility network web trace tool with Javascript
It’s time to show the power of the services oriented architecture nature of the Utility Network Management extension. Currently ArcGIS Pro is the richest client for utility network functionality. However, that doesn’t mean that the functionality is not available for … Continue reading
Maps App JavaScript
Example App: Maps App JavaScript The ArcGIS for Developers Example Apps are a great way to start working with the ArcGIS Platform through the lens of a specific ArcGIS product. These example applications are designed to address real world needs, … Continue reading
Web Development Session Guide to the 2018 Developer Summit
The 2018 Esri Developer Summit in Palm Springs, CA is right around the corner. It will feature a lineup of more than 50 technical sessions and demo theaters focused on web development and ArcGIS API for JavaScript topics. With so … Continue reading
Scene Layer Performance on ArcGIS Online
You can use 3D object and integrated mesh scene layers based on the OGC® I3S Community Standard to create compelling visualizations directly in your browser. We are using various techniques to make the user experience as smooth as possible on … Continue reading
Web AppBuilder for ArcGIS v2.7 Developer Edition Now Available!!
FYI: Web AppBuilder for ArcGIS v2.7 Developer Edition is now available for download from the ArcGIS Developer’s Site. This update includes the new capabilities that were part of the Web AppBuilder for ArcGIS release embedded in ArcGIS Online last month. Please … Continue reading
Tips and Tricks for Navigating the ArcGIS API for JavaScript Website
At version 4.0, we didn’t just rebuild the API to make it stronger and more efficient, we also rebuilt the SDK to make it easier for developers to find the information they need to be successful. A previous blog post … Continue reading
ArcGIS API for JavaScript – Improved Website Accessibility
At version 4.6 (and 3.23), we introduced some website enhancements that included Keyboard Accessibility support to the Home, Guide, API Reference, Sample Code, and Sandbox pages. These new keyboard shortcuts will increase your productivity by making the SDK easier to navigate. … Continue reading
Improved TypeScript development with ArcGIS API for JavaScript
The TypeScript declaration file for the ArcGIS API for JavaScript contains type information specific for the API. You can learn more about how to install this file from the TypeScript set up guide page or on GitHub. The version 4.6 … Continue reading
Making Better Promises
This blog post will discuss a change to our implementation of promises, a change towards making a better promise. Numerous classes in the ArcGIS API for JavaScript resolve to promises. This is the case for WebMap, WebScene, MapView, SceneView, Basemap, Ground, Layers, and LayerViews. Typically, you would use the then() method … Continue reading
ArcGIS API for JavaScript versions 4.6 and 3.23 released
Just in time for the new year, Versions 4.6 and 3.23 of the ArcGIS API for JavaScript have arrived, bringing new capabilities such as a directions widget, 3D measurement widget, and layer refresh. Here are some of the release highlights you’ll … Continue reading
Another Successful DevSummit Europe in Berlin
Now, in our fifth annual Developer Summit Europe conference, as much as we have learned over the years, we have also grown and are better than ever. Here are some highlights from the event and all of the enriching sessions, … Continue reading
Creating a custom tile layer with TypeScript
The ArcGIS API for JavaScript provides you with many different layer types that support various data types and visualizations. We also provide you with the building blocks for creating your own custom layer types. These are BaseTileLayer, BaseDynamicLayer, and BaseElevationLayer … Continue reading
Unwinding the Clock: Visualizing Time with Arcade
Recording times and dates can be invaluable during the data collection phase of a project. Date data help us answer questions like, “When did this incident occur?”, “How long did it take to accomplish task A?”, or “What assets are … Continue reading
Web AppBuilder for ArcGIS v2.6 Developer Edition Now Available!
FYI: Web AppBuilder for ArcGIS v2.6 Developer Edition is now available for download from the ArcGIS Developer’s Site. This release includes the new capabilities that were recently added to the embedded Web AppBuilder for ArcGIS in ArcGIS Online last month. Please … Continue reading
Thematic point clustering for data exploration
Extracting meaningful information from large or dense point datasets can be challenging. Sometimes many points aren’t visible because they’re stacked on top of one another. Some datasets contain sparse data in some locations, but very dense data in others. Visualizations … Continue reading
Speed up your JavaScript development with autocasting
In the 4.5 release of the ArcGIS API for JavaScript, autocasting support was expanded to all renderers, symbols, and symbol layers. This means that symbols and renderers can be created programmatically without importing their modules. All you need to do … Continue reading
FeatureLayer rendering: taking advantage of WebGL in 2D
The 4.5 version of the ArcGIS API for JavaScript allows users to opt in to rendering FeatureLayer with WebGL (beta) in 2D MapViews. This is a major step in improving the overall performance of FeatureLayer, providing you with the ability … Continue reading
ArcGIS API for JavaScript versions 4.5 and 3.22 released
Version 4.5 of the ArcGIS API for JavaScript adds some key capabilities and several smaller (but sweet) enhancements that will come in handy. Here are the highlights in 4.5 (as well as 3.22); a full overview detailing new features can … Continue reading
Top Five Reasons to Attend DevSummit Europe in Berlin
We are counting down the days to DevSummit Europe in Berlin! We hope that you are too, and if you’re still not sure if this is the event for you, check out our Top Five Reasons why we feel it … Continue reading
React Redux: Building Modern Web Apps with the ArcGIS JS API
I would like to share my experience building a React Redux app with the ArcGIS API for JavaScript (ArcGIS JS API). It is exciting how well these work together. I will also share some boilerplate source code to help you … Continue reading
Never Want DevSummit to End? Keep It Rollin’ with the GeoDev Webinars!
The Developer Outreach Team is proud to announce the solution to your DevSummit withdrawals! We listened and are excited to keep the greatest developer event going throughout the year via our GeoDev Webinar series. For more on this, check out … Continue reading
Web AppBuilder for ArcGIS v2.5 Developer Edition Now Available!
Following on last week’s busy User Conference, we are happy to announce that Web AppBuilder for ArcGIS v2.5 Developer Edition is now available for download from the ArcGIS Developer’s Site. This release includes the new capabilities that were recently added … Continue reading
Manhattan Skyscraper Explorer – when Open Data and ArcGIS API for JavaScript meet
Open data is an awesome thing nowadays. It’s amazing how many organizations publish their data to allow citizens to learn more about the city they live in. Examples of such datasets are the New York 3D city model and the Housing … Continue reading
ArcGIS API for JavaScript Versions 4.4 and 3.21 Are Here!
The latest releases of the ArcGIS API for JavaScript are packed with useful new enhancements and capabilities. Version 4.4 gives you more control over visualizing and interacting with 3D data, includes deeper web map support, and brings in OGC layer … Continue reading
Explore Eight Incredible Apps at the 2017 User Apps Fair
Visit the 2017 User Apps Fair! The 2017 User Apps Fair will showcase the best customized applications that utilize Esri technology. These competitors will present and display their applications at the 2017 Esri User Conference from Tuesday, July 11th through … Continue reading
Web AppBuilder for ArcGIS at UC 2017
In a few weeks, the 2017 Esri International User Conference will be in full swing in San Diego, CA. If you haven’t already, you can register to attend the event here. The Web AppBuilder for ArcGIS Dev team will be … Continue reading
Creating a predominance visualization with Arcade
At the March 2017 Esri Developer Summit, Dave Bayer and I gave a presentation on how to use Arcade expressions in web apps built on the ArcGIS platform. In that presentation I demonstrated a succinct way to create a predominance … Continue reading
Creating a Custom Widget for Web AppBuilder for ArcGIS using the Report Class
This blog post was contributed by Artemis Fili, a Technical Lead (SDK Team) in Technical Support Services at the Esri Redlands, CA office. Esri Technical Support likes to use Web AppBuilder for ArcGIS to create powerful web applications. Web AppBuilder … Continue reading
C-Through – A Prototype for Interactive 3D Urban Planning Analysis on the Web
UPDATE: View a live sample of the application and and learn how to build your own c-through by forking the code on GitHub. Urban planning is a challenging task, especially for extensive infrastructure and building projects in mixed-use areas where … Continue reading
Web AppBuilder for ArcGIS v2.4 Developer Edition Now Available!
Quick announcement: Web AppBuilder for ArcGIS v2.4 Developer Edition is now available for download from the ArcGIS Developers Site. This release includes the new capabilities that were recently added to the embedded Web AppBuilder for ArcGIS in ArcGIS Online earlier … Continue reading
ArcGIS API for JavaScript 4.3 and 3.20 released
We are excited to announce the releases of both the 4.3 and 3.20 versions of the ArcGIS API for JavaScript. Version 4.3 continues to build upon its current functionality and bring existing features from 3.x into 4 while also introducing … Continue reading
The New ArcGIS Developer Program is here!
The ArcGIS Developer Program has arrived! It’s a new, improved developer experience designed to be simple and flexible while giving you access to the software and tools you need when developing your solutions. As part of the ArcGIS Developer Program, we have … Continue reading
DevSummit Technical Session Guide for the Web Developer
The 2017 Esri Developer Summit in Palm Springs, CA is right around the corner! It will feature a lineup of more than 50 technical sessions and demo theaters focused on web development topics. With so many to choose from, the … Continue reading
Enliven your web apps with custom actions
The 4.x series of the ArcGIS API for JavaScript introduced the concept of actions. An action is a task that can be triggered by a user by clicking its simple button interface. For example, clicking the magnifying glass button on … Continue reading
Web AppBuilder for ArcGIS v2.3 Developer Edition Now Available!
Quick announcement: Web AppBuilder for ArcGIS v2.3 Developer Edition is now available for download from the ArcGIS Developers Site. This release includes many new capabilities that were recently added to the embedded Web AppBuilder for ArcGIS in ArcGIS Online in Dec … Continue reading
The Esri community and JavaScript Team at Esri
We love getting direct feedback from our user community! The purpose of this blog post is to introduce users of the ArcGIS API for JavaScript to some new functionality in the Sample Code section of the website and to foster … Continue reading
Using Arcade expressions in web apps
At the end of 2016 Esri released Arcade, a light-weight scripting language designed to evaluate expressions in labeling and rendering contexts with apps built on the ArcGIS platform. Arcade is similar to other scripting and expression languages, such as SQL, … Continue reading
ArcGIS API for JavaScript 4.2 released
The ArcGIS API for JavaScript 4.2 is available, introducing new widgets, smart mapping in 2D and 3D, vector tiles in 3D, support for Arcade, and new events in the MapView and SceneView. Custom widget development In addition to the Esri-provided … Continue reading
ArcGIS API for JavaScript 3.19 released
The ArcGIS API for JavaScript 3.19 is now available, allowing you to write Arcade expressions for custom visualizations and labels, and to consume vector tiles in any supported ArcGIS spatial reference. Arcade integration for visualization and labeling Arcade is a … Continue reading
What’s Coming in the ArcGIS API 4.2 for JavaScript
We are in the home stretch preparing the next 4.x release of the ArcGIS API for JavaScript. Here are a few highlights about the release that developers can look forward to. Vector Tile Layers Revamped … in 2D AND 3D! … Continue reading
Workforce for ArcGIS v1.1 Release (Web)
We are excited to announce the 1.1 release of Workforce for ArcGIS web app. This is the second release of Workforce and it contains some important updates for both Project Owners as well as Dispatchers. Project Owners Project owners can … Continue reading
Web AppBuilder for ArcGIS v2.2 Developer Edition Now Available!
Quick announcement: Web AppBuilder for ArcGIS v2.2 Developer Edition is now available for download from the ArcGIS Developers site. This release includes many new capabilities that were recently added to the embedded Web AppBuilder for ArcGIS in ArcGIS Online last … Continue reading
ArcGIS API for JavaScript Version 3.18 released
The ArcGIS API for JavaScript 3.x series continues to support a breadth of ArcGIS web apps and of course many of your apps. We are actively developing on version 3.x (simultaneously with the 4.x series) in order to enable 3.x-based … Continue reading
ArcGIS API for JavaScript 4.1 Released
The second release in the 4.x series of the ArcGIS API for JavaScript is now available. Our next-generation JS API continues along its path to reach parity with 3.x, while also introducing new powerful capabilities such as 3D. The following … Continue reading
Web AppBuilder for ArcGIS v2.1 Developer Edition Now Available!
We had a very busy 2016 Esri User Conference in San Diego last month, where we met with many folks from the Web AppBuilder user community. Since the conference, the team has worked hard to complete the release of Web … Continue reading
ArcGIS API for JavaScript Version 3.17 released
The ArcGIS API for JavaScript version 3.17 is available today. This release drives many of the new features released in the ArcGIS Online (June 2016) release, and other minor enhancements and bug fixes. For a complete list of changes, see … Continue reading
Play in the JavaScript symbol playground
Version 3.15 of the ArcGIS API for JavaScript introduced a convenient new app called the Symbol Playground to help developers create symbology for visualizing features in web applications. This app helps improve the experience for designing, coding, and ultimately understanding … Continue reading
What’s New in Web AppBuilder for ArcGIS (June 2016)
This update has many new and exciting features – many have been requested many times from our users. We’ve listened to the Web AppBuilder user community feedback and we’re pleased to announce the following new enhancements to Web AppBuilder: 7 … Continue reading
Web AppBuilder for ArcGIS at UC 2016
It’s that time of year again when “geospatial-minded” techies gather together to learn about GIS! The 2016 International Esri User Conference (June 27–July 1) is a few weeks away and the Web AppBuilder Dev team will be working in the … Continue reading
Smart Mapping with dynamic workspaces
Not too long ago I wrote a post about how and why you may want to use Smart Mapping in custom web apps using the ArcGIS API for JavaScript. The sample featured in that post showed how to dynamically change … Continue reading
It’s here! ArcGIS API for JavaScript 4.0 Released
It is with great pleasure we announce the first release of the 4.x series of the ArcGIS API for JavaScript. You can now starting building web apps with the production release of the ArcGIS API 4.0 for JavaScript! Version 4.0 … Continue reading
Increased web API security in Google Chrome
Starting with Google Chrome version 50, some of the HTML5 web APIs will require websites to be using a secure origin like HTTPS to work correctly. The APIs that will be affected are: Geolocation, Fullscreen, Device motion and Device orientation. What does it mean? Simply put, unless sites are running … Continue reading
Web AppBuilder for ArcGIS v2.0 Developer Edition Now Available!
We are pleased to announce the release of Web AppBuilder for ArcGIS Developer Edition v2.0, which is now available from the ArcGIS Developers Site!! This release includes the new capabilities that were added to Web AppBuilder embedded in ArcGIS Online … Continue reading
Using Smart Mapping in custom web apps
Smart Mapping was released last year in the ArcGIS API for JavaScript, ArcGIS Online, and Portal for ArcGIS, providing easy-to-use tools for generating attractive default visualizations of geographic data on the web. The ArcGIS Online Map Viewer fully equips users … Continue reading
ArcGIS API for JavaScript Version 3.16 released
The ArcGIS API for JavaScript version 3.16 was released today deploying several new features, enhancements, and bug fixes. Headlining this release is the improved Feature Table, which now supports editing feature attributes within the table. We also made improvements to … Continue reading
What’s New in Web AppBuilder for ArcGIS (March 2016)
The latest ArcGIS Online update of Web AppBuilder for ArcGIS includes many new capabilities that offer you even more options for creating and deploying new web apps: Support for 3D visualization Web AppBuilder now fully supports and works with 3D … Continue reading
3D visualization: Using attributes to represent real-world sizes of features
This is the final post in a three-part series exploring 3D data-driven visualizations in web applications using the ArcGIS API for JavaScript version 4.0. 1. Working with icons, lines, and fill symbols 2. Working with objects, paths, and extrusion 3. … Continue reading
Web AppBuilder for ArcGIS Developer Edition Now Supports 3D (Beta)!!
We are pleased to announce the release of Web AppBuilder for ArcGIS Developer Edition v2.0 Beta. You can now bring 3D into your own web apps! Get it from the Esri Early Adopter Community Web Site. Over the past few … Continue reading
3D visualization: working with objects, paths, and extrusion
This is the second post in a three-part series exploring 3D data visualization in web applications using the ArcGIS API for JavaScript version 4.0. 1. Working with icons, lines, and fill symbols 2. Working with objects, paths, and extrusion 3. … Continue reading
3D visualization: working with icons, lines, and fill symbols
This is the first post in a three-part series exploring 3D attribute-based visualizations in web applications using the ArcGIS API for JavaScript version 4.0. In this post we’ll primarily discuss working with flat 3D symbols – icons, lines, and fill … Continue reading
Multivariate Rendering – 2D visualization techniques in JavaScript
Smart Mapping was added to the ArcGIS API for JavaScript in version 3.13 to provide web developers with an easy way to generate renderers with smart, visually pleasing defaults based on data distribution and the basemap. This new module helps … Continue reading
ArcGIS API for JavaScript 4.0 beta 3 released
We are excited to announce that beta 3 of the ArcGIS API for JavaScript 4.0 is now available. The following are some of the highlights of this release. Developer-friendly widgets All widgets in version 4.0 of the ArcGIS API for … Continue reading
Storing large volumes of imagery and rasters in the cloud
Storing large volumes of data in the cloud Storing large volumes of imagery in the cloud and transmitting the data to client applications has always created a quandary. Do you want it large, slow and accurate; or fast, small and … Continue reading
Web AppBuilder for ArcGIS v1.3 Developer Edition Available This Week!
We would like to announce that Web AppBuilder for ArcGIS v1.3 Developer Edition, will be available for download this week from the ArcGIS for Developer’s site. The latest Developer Edition of Web AppBuilder includes many new capabilities that were added to … Continue reading
ArcGIS API for JavaScript Version 3.15 released
Version 3.15 of the ArcGIS API for JavaScript introduces vector tiles, better maps through predominance renderers, legend improvements, and many other bug fixes and API enhancements. GeometryEngine and FeatureTable also are no longer beta. Vector tiles Vector tiles display cached … Continue reading
Announcing the Story Maps Developers’ Corner
Esri’s Story Maps Team has a new resource for developers. It’s published on the blogging site Medium, and we call it the Story Maps Developers’ Corner. Whether you can write JavaScript classes in your sleep or are only comfortable editing … Continue reading
ArcGIS API for JavaScript 4.0 beta 2 released
We are excited to announce that beta 2 of the ArcGIS API for JavaScript 4.0 is now available. We have been busy working on adding functionality to the next generation JavaScript API, which includes new layer types, a redesigned popup … Continue reading
Using Bower for custom builds of ArcGIS API for JavaScript
Esri recently released a Bower package to enable local custom builds of the API. The advantage of using a custom build is that your application downloads and parses only the required JavaScript resources which will make your application load faster. … Continue reading
What’s New in Web AppBuilder for ArcGIS (November 2015)
Chicago Black Hawks – Hockey. FC Barcelona and the US National Women’s Team – Soccer. Kansas City Royals – Baseball. The All Blacks – Rugby. (Note: All team logos in the graphic above are trademarked and owned by their respective … Continue reading
Creating a simple basemap picker for your apps in AppStudio using QML and JavaScript
A basemap is an essential mapping component for providing relativity and context to spatial data displayed on a map. Providing users the option to select from a variety of basemaps can offer a more refined finish and custom option to … Continue reading
GeometryEngine part 3: Overlay analysis
This is the final post in a three-part series exploring the client-side GeometryEngine in the ArcGIS API for JavaScript. This series covers the following topics: Part 1: Testing spatial relationships and editing Part 2: Measurement Part 3: Overlay Analysis In the … Continue reading
GeometryEngine part 2: Measurement
This is the second post in a three-part series exploring the client-side GeometryEngine in the ArcGIS API for JavaScript. This series covers the following topics: Part 1: Testing spatial relationships and editing Part 2: Measurement Part 3: Overlay Analysis Last week … Continue reading
GeometryEngine part 1: Testing spatial relationships and editing
This is the first post in a three-part series exploring GeometryEngine in the ArcGIS API for JavaScript. This series will cover the following topics: Part 1: Testing spatial relationships and editing Part 2: Measurement Part 3: Overlay Analysis Overview Earlier … Continue reading
Qt and JavaScript: A Perfect Match for Native App Development
There are many developer platforms and languages to choose from if you’re planning on building native cross-platform apps. In this article, we’ll take a look at a highly popular one, yet one that you wouldn’t immediately think of for pure … Continue reading
Web AppBuilder for ArcGIS v1.2 Developer Edition Available This Week!
We would like to announce the forthcoming release of Web AppBuilder for ArcGIS v1.2 Developer Edition, which will be available for download later this week from the ArcGIS for Developer’s site. The latest Developer Edition of Web AppBuilder includes many … Continue reading
ArcGIS JavaScript Promises and Web Mobile (Part 1)
Promises, promises [insert Naked Eyes song here]. Major changes coming at ya here in the next major release of ArcGIS API for JavaScript v4 and we’re now ready to start brushing up in v4 beta1. Check out my blog post … Continue reading
ArcGIS API for JavaScript 4.0 beta 1 – available today
Version 4.0 is the next generation ArcGIS API for JavaScript and it supports both 2D and 3D. Today we are announcing the first beta version – 4.0 beta 1. Discover 4.0 With version 4.0, the API continues to be a modern, … Continue reading
ArcGIS API for JavaScript Version 3.14 Released
The 3.14 version of the ArcGIS API for JavaScript is now available, which adds more than 30 new classes, dozens of bug fixes, and other enhancements to the API. You can see a complete list of these improvements and bug … Continue reading
Web AppBuilder for ArcGIS at UC 2015
Can you feel the anticipation and GeoGeek excitement? The 2015 Esri International User Conference (July 20–24) is one week away and the Web AppBuilder Dev team will be working in the main Showcase Hall (ArcGIS Online island) and presenting several … Continue reading
What’s Coming in Web AppBuilder for ArcGIS in the ArcGIS Online July update
The number “5” is unique and has some special significance … In numerology, it is the most dynamic and energetic single-digit number There are 5 senses: sight, hearing, smell, taste, and touch Giving a “high five” is considered to be … Continue reading
Incredible Antarctica and the Larsen B Ice Shelf
Antarctica…one of the last wilderness frontiers. With all the talk in the news these days about the Larsen B Ice Shelf in Antarctica breaking apart, I thought I’d see what information I could find out about it from an imagery … Continue reading
Web AppBuilder for ArcGIS – Live Sites Showcase
There’s been a lot of excitement around Web AppBuilder, because it enables you to create new custom web mapping applications in an intuitive, easy to use, WYSIWYG wizard-like environment. You can create apps that run on any device without having … Continue reading
Clarifying 3 questions about Web AppBuilder for ArcGIS
Web AppBuilder for ArcGIS enables you to create new custom web mapping applications in an intuitive, easy to use, WYSIWYG wizard-like environment. It provides you with the optimal means to create and deploy new web apps without programming. Built on … Continue reading
Web AppBuilder for ArcGIS v1.1 Developer Edition Now Available!
Web AppBuilder for ArcGIS enables you to create and deploy new custom web apps that can run on any device without programming. Built on the ArcGIS API for JavaScript and HTML5 technology, the Developer Edition enables you to extend the … Continue reading
ArcGIS API for JavaScript Version 3.13 Released
Version 3.13 of the ArcGIS API for JavaScript is now available! Below is an overview of the release including new features, enhancements, and changes included in version 3.13. For a complete list with API enhancements and bug fixes, check out … Continue reading
ArcGIS API for JavaScript Version 3.12 Released
Version 3.12 of the ArcGIS API for JavaScript is now available! Below is an overview of the release including new features, enhancements, and changes included in version 3.12. For a complete list with API enhancements and bug fixes, check out … Continue reading
Data Visualization with ArcGIS API for JavaScript: Show Data by Size
When there are a bunch of numbers you want to visualize on map, in addition to the previously introduced show data by color approach, another popular technique is to show data by size. This technique is also called proportional symbol … Continue reading
Data Visualization with ArcGIS API for JavaScript: Show Data by Color
Mapping data values by varying the color has been the most popular way to visualize geospatial data. Academically it is called choropleth by cartographers. If you do an image search for “US population map” online, 90% of the results would … Continue reading
ArcGIS API for JavaScript Version 3.11 Released
Version 3.11 of the ArcGIS API for JavaScript is now available! Below is a listing of 14 new features, enhancements and changes included in this release. For a complete list with API enhancements and bug fixes, check out the What’s … Continue reading
The GeoForm Graduates
Need to gather some simple information and put it on a map? The GeoForm is a configurable web mapping application template for form-based data editing of a Feature Service through the web browser. This application allows users to enter data through a form instead … Continue reading
Data Visualization with ArcGIS API for JavaScript: Enhancement Options
In the previous posts, we already learned how to display your data, and how to style your data by unique value with JavaScript API. You might feel content with simply displaying data on a map, but your audience may expect something beyond this. … Continue reading
Data Visualization with ArcGIS API for JavaScript: Show Data by Unique Value
In the first post of this series, I mentioned a good way to determine which way to visualize your data is to ask questions about the purpose of the map. In addition to “where things are,” which we already examined … Continue reading
Data Visualization with ArcGIS API for JavaScript
In the past year, we added some powerful, innovative, easy-to-use graphic drawing functionality in the ArcGIS API for JavaScript. Along with existing capabilities of the API, now you can easily create effective data visualizations on the map with a few lines of … Continue reading
ArcGIS API for JavaScript Version 3.10 Released
Version 3.10 of the ArcGIS API for JavaScript is now available! Below is a complete listing of new features, enhancements and changes included in this release. The same information is available in the What’s New in 3.10 page in the … Continue reading
Come geek out with us at the UC
Come SpeedGeeking with us at the 2014 Esri User Conference! As a developer-focused activity, SpeedGeeking gets its name and style from speed dating. SpeedGeeking features 12 presenters who, at the same time, will be giving lightning talks to a group … Continue reading
Impact Summary: Dazzle Them With Your Data
Esri’s Disaster Response Program helps support worldwide incidents, such as earthquakes, floods, wildfires, and severe weather. To increase public knowledge of the disaster impacts, we wanted an app to highlight areas and show related statistics, such as data that shows … Continue reading
ArcGIS API for JavaScript Web Optimizer in public beta
The ArcGIS API for JavaScript Web Optimizer is a web application that generates custom builds of Esri’s JavaScript API. Today, we’re happy to announce that the web optimizer is in public beta and available to all with an organizational or … Continue reading
Who’s Ready for a Makeover?
The Social Media Template, a popular web application template on ArcGIS Online, has been redesigned, made responsive and given a new name. Introducing: the Public Information template (hold applause). Big difference, huh? This is a fully configurable template that allows … Continue reading
ArcGIS API for JavaScript Version 3.9 Released
Version 3.9 of the ArcGIS API for JavaScript is now available! Below is a complete listing of new features, enhancements and bug fixes included in this release. The same information is available in the What’s New in 3.9 page in �… Continue reading
Operations Dashboard in a browser
In March we rolled out quite a few updates to Esri products and the Operations Dashboard for ArcGIS was no exception. A lot of exciting new features were added and you can find a full list of updates on our … Continue reading
Esri’s Roadmap for Web Developers
This post is designed to provide clarity on the future of our Flex and Silverlight development efforts. In order to align our product road maps, we continually monitor general web technology trends and the direction of our customers’ development efforts. … Continue reading
JavaScript Coders and the DevSummit DC
We’re all looking forward to seeing you at the first annual Esri Developer Summit, Washington, DC next week (Wednesday, February 12th). In addition to a two-hour Plenary session in the morning, there will be a whole day’s worth of deeper … Continue reading
Development strategies for targeting Android, iOS, and Windows Phone
Everyone knows that consumer devices are now in the hands of everyone from toddlers to your grandparents, and your information when designed for mobile, can reach more individuals than ever before. You may know that you need a mobile strategy, … Continue reading
ArcGIS API for JavaScript Version 3.8 Released
Version 3.8 of the ArcGIS API for JavaScript is now available! Below is a complete listing of new features, enhancements and bug fixes included in this release. The same information is available in the What’s New in 3.8 page in … Continue reading
Pan faster than you can say optimizePanAnimation
The 3.7 release of the JavaScript API was a big one, with many great new features. One thing we added was a new map configuration option called optimizePanAnimation. It was a single bullet point in a long list so a … Continue reading
The abc’s of AMD
To help our JavaScript SDK users still grasping Dojo’s AMD pattern we thought it would be worthwhile to compare one of the ‘latest and greatest’ AMD samples to the same app written using the older legacy pattern and discuss the differences. … Continue reading
Listening to the Pulse of your State with the Executive Dashboard
The ArcGIS for State Government solution recently released a configurable Executive Dashboard for State Government. This JavaScript application allows decision makers to view critical metrics, identify trends, raise questions, and devise new management strategies in response to those trends. It … Continue reading
New weapons for your webmaps!
Our latest version of the JavaScript API (version 3.7) includes new map widgets for you to take advantage of and make killer apps. While creating web applications to aid our Disaster Response program, we noticed some commonly used mapping elements … Continue reading
ArcGIS API for JavaScript Version 3.7 Released
Version 3.7 of the ArcGIS API for JavaScript is now available! Below is a complete listing of new features, enhancements and bug fixes included in this release. The same information is available in the What’s New in 3.7 page in … Continue reading
Step-up to the boilerplate
Take some development work off of your plate and get a jump on building ArcGIS API for JavaScript apps by starting with the JavaScript Application Boilerplate. After developing a few ArcGIS Online hosted templates, such as the Social Media and … Continue reading
ArcGIS for State Government – Released
The first release of ArcGIS for State Government went live today! As part of this release, we have a series of maps and applications to support a few of the needs identified by the state user community. Each of the … Continue reading
Upcoming maintenance to ArcGIS Online system (services.arcgisonline.com and server.arcgisonline.com) on Wednesday, August 14th
The ArcGIS Online team will update the SSL certificates on the ArcGIS Online system (services.arcgisonline.com and server.arcgisonline.com) during a two hour maintenance window starting on Wednesday, August 14th, 2013, at 3:30 p.m. PST. This system hosts the ArcGIS Online basemaps. … Continue reading
ArcGIS API for JavaScript Version 3.6 Released
Version 3.6 of the ArcGIS API for JavaScript is now available! Please refer to the What’s New in 3.6 for the full list of features and bug fixes. Highlights include: New CDN URL for the API The ArcGIS API for … Continue reading
Esri Supports Hack For Change Across the Nation!
Across the United States on the weekend of June 1-2, coders, software developers, entrepreneurs, and citizens of all kinds worked together to try to improve our societies through the National Civic Day of Hacking. Using open data and technology, teams collaborated … Continue reading
Upcoming maintenance to ArcGIS Online JSAPI system (serverapi.arcgisonline.com) during a one hour maintenance window starting on Thursday, June 6th at 5pm PST
The ArcGIS Online team will update the SSL certificates on the ArcGIS API for JavaScript system (serverapi.arcgisonline.com) during a one hour maintenance window starting on Thursday, June 6th, 2013, at 5 p.m. PST. The change is not expected to impact … Continue reading
ArcGIS API for JavaScript Version 3.5 Released
Version 3.5 of the ArcGIS API for JavaScript is now available! Please refer to the What’s New in 3.5 for the full list of features and bug fixes. Highlights include: Support for class.on() style events for the map, layers and … Continue reading
ArcGIS API for JavaScript Doc Update
We’ve published some updates to the JS API docs. Specifically: More samples in our sandbox. Samples that are a single file now have links to our sandbox where you can edit and see changes live. Where applicable, sample description pages … Continue reading
ArcGIS API for JavaScript Version 3.4 Released
Version 3.4 of the ArcGIS API for JavaScript is now available! Please refer to the What’s New in 3.4 document for the full list of features and bug fixes. Highlights include: Directions widget Allow users to calculate driving directions between … Continue reading
ArcGIS API for JavaScript Version 3.3 Released
Version 3.3 of the ArcGIS API for JavaScript is now available! Please refer to the What’s New in 3.3 document for the full list of features and bug fixes. Highlights include: New geocoder widget Add a geographic search box to … Continue reading
New release of Thematic Atlas sample application
There is a new version of the Esri Thematic Atlas available at http://atlas.esri.com. The Thematic Atlas sample application lets you showcase a collection of intelligent web maps, focused around specific themes. The Esri Thematic Atlas sample application uses web maps and the ArcGIS … Continue reading
Using Social Media to #tag @your Map
Wondering what people are talking about in an area? Would it be a nice addition to the data on your map? We’ve got you covered! With the Social Media template, your web app can display what people are saying through … Continue reading
Heat Up Your Webmaps
Looking to create a colorful heat-map using the ArcGIS JavaScript API? A beautiful heat-map is just a layer away using the heatmap.js library. This open source library developed by Patrick Wied uses JavaScript and HTML5 Canvas to draw ridiculously good-looking … Continue reading
ArcGIS API for JavaScript Version 3.2 Released
Version 3.2 of the ArcGIS API for JavaScript is now available! Please refer to the What’s New in 3.2 document for the full list of features and bug fixes. Highlights include: Support for pinch zoom on Android 3+ Android devices … Continue reading
Making Your Pop-up Pop!
Want to make a beautiful pop-up to match your map or website? With a little elbow grease, CSS, and a keen eye for design, it’s easy. Here’s how you can skin the ArcGIS API for JavaScript pop-up widget. The pop-up … Continue reading
ArcGIS API for JavaScript Version 3.1 Released
Version 3.1 of the ArcGIS API for JavaScript is now available! Please refer to the What’s New in 3.1 document for the full list of features and bug fixes. Highlights include: Attribution Widget Attribution Widget added to the API to … Continue reading
Developer Summit Europe
To build on the success of recent Developer Summit in California, we’ve decided to take the event on the road. Esri will be hosting 3 Dev Summits in Europe this September. I hope developers from all over Europe and the world will … Continue reading
ArcGIS API for JavaScript Version 3.0 Released
Version 3.0 of the ArcGIS API for JavaScript is now available! Please refer to the full What’s New in 3.0 document for the full list of features and bug fixes. Highlights include: Features Support for new features in ArcGIS Server 10.1 including: … Continue reading
Writing Unit Tests for Your ArcGIS API for JavaScript Apps
Whether you’re working with an existing application, or you’re planning a new app, unit testing provides an efficient, dependable way to verify that your code functions as expected and ensure that your app’s features work. In a nutshell, unit testing … Continue reading
ArcGIS API for JavaScript Version 2.8 Released
Version 2.8 of the ArcGIS API for JavaScript is now available! Highlights include: Features Portal for ArcGIS API: An API to build applications that works with content from ArcGIS Online or an ArcGIS Portal Support for ArcGIS Server 10.1 editor tracking … Continue reading
Questions and answers about HTML5 and ArcGIS
We recently presented a live training seminar titled Using HTML5 with ArcGIS. In the seminar we provided an overview of HTML5 and looked at a number of common examples of how to use HTML5 in your GIS applications. We also … Continue reading
ArcGIS API for JavaScript Version 2.7 Released
Version 2.7 of the ArcGIS API for JavaScript is now available! Highlights include: Superpan map navigation is now the default when using an Apple trackpad or magic mouse. More information is available in the Map Navigation conceptual help topic. Feature … Continue reading
Esri picture marker symbol generator for JavaScript developers
The ArcGIS.com map viewer provides a nice collection of picture marker symbols that can be used to symbolize features on your map. If you’re a developer, you might wonder how you can use these symbols in your applications. You could … Continue reading
Enhanced map navigation for Mac OS X using ArcGIS API for JavaScript
With the release of OS 10.6 Snow Leopard and Lion OS, the Mac Magic Trackpad and Magic Mouse allow you to interact with the system using touch gestures like tap, scroll and swipe. While not all gestures are passed on as native … Continue reading